Remote Debugging Using GDB Server
This post covers how to do remote debugging using the debugger tools gdbserver and gdb.
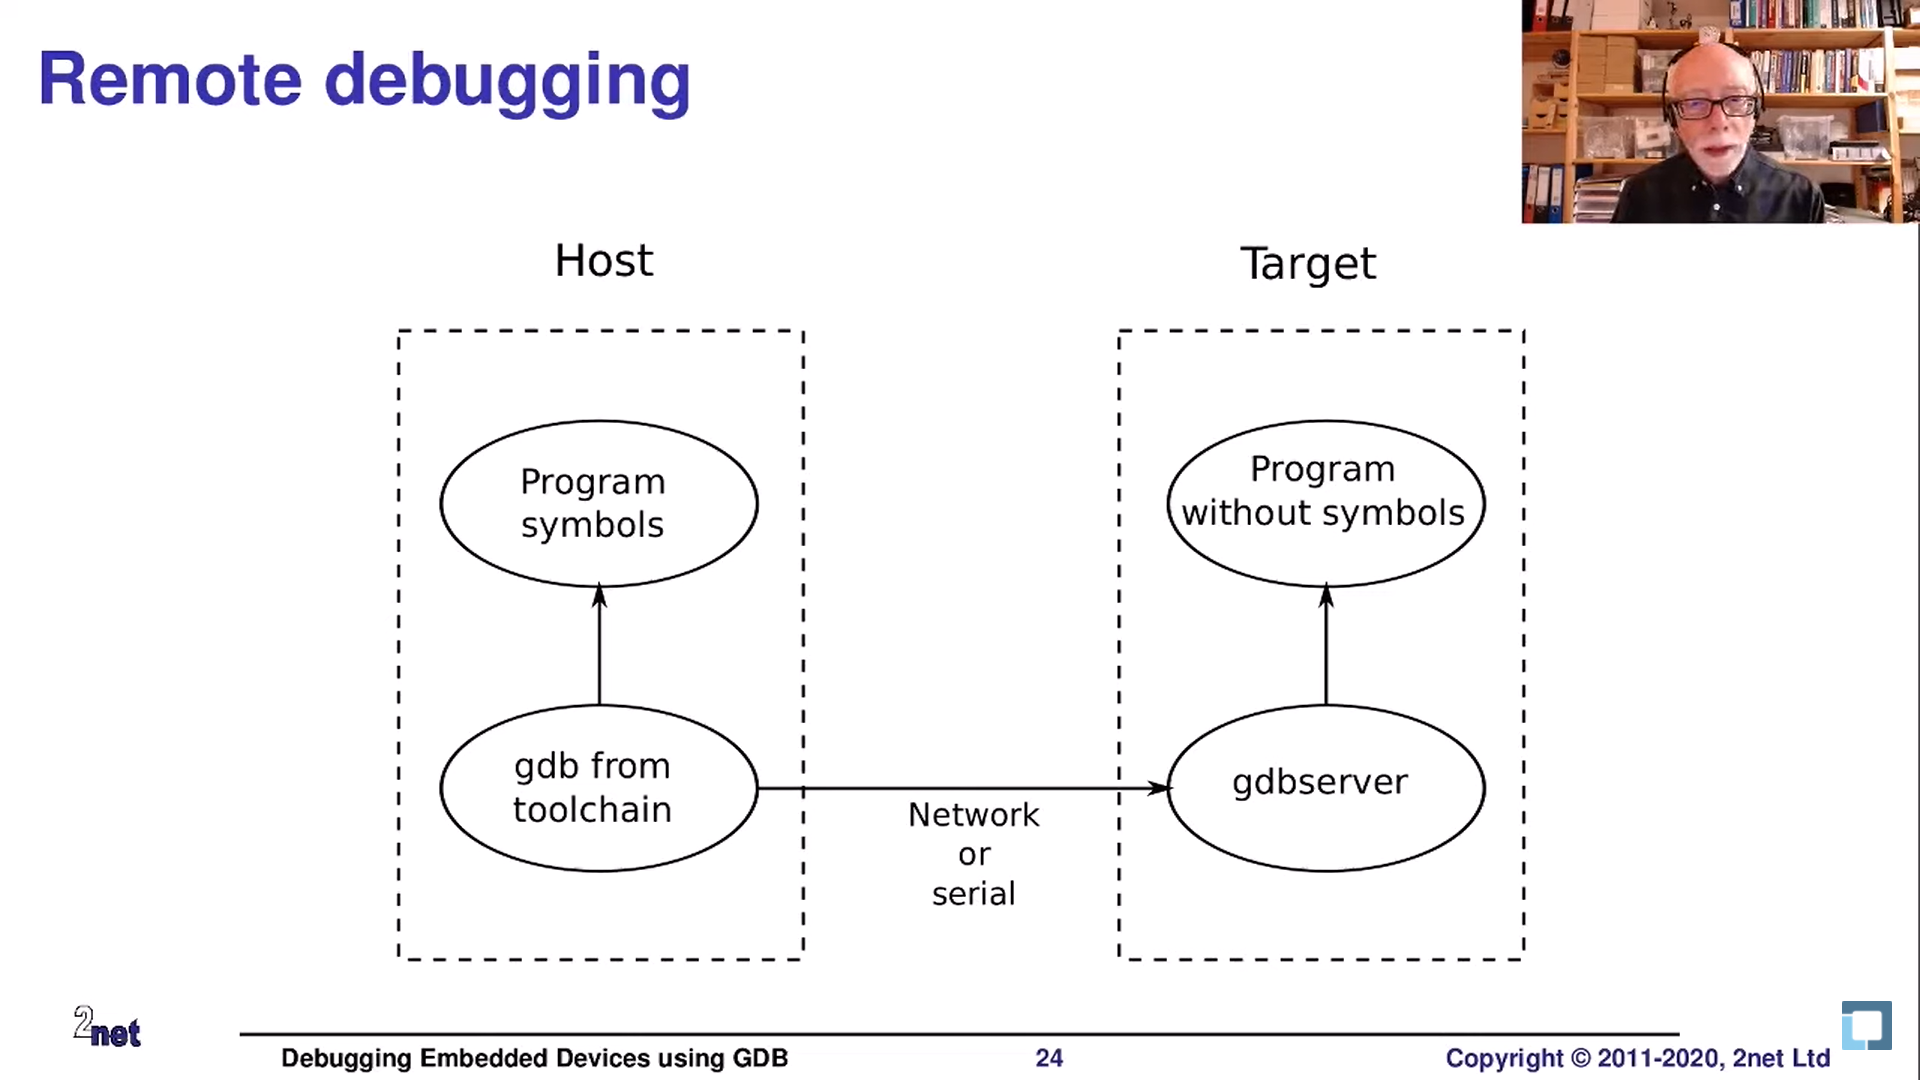
Remote debugging is a method where you run gdbserver on the target where the application is actually running, and debug using gdb and toolchain from a remote host.
 Ref. Linux Foundation Conference 2020
This method involves running an application on the target with optimizations and debugging symbols removed through gdbserver listening, while the remote host connects to gdbserver using gdb with an application that includes optimizations and debugging symbols through the toolchain for debugging.
When the target is an embedded board, disk memory capacity and system memory capacity are very limited, making remote debugging useful in such cases.
Breaking into Examples
- Before the detailed explanation, I’ll assume you basically know how to use gdb from the command line to some extent.
0. Setting up Environment
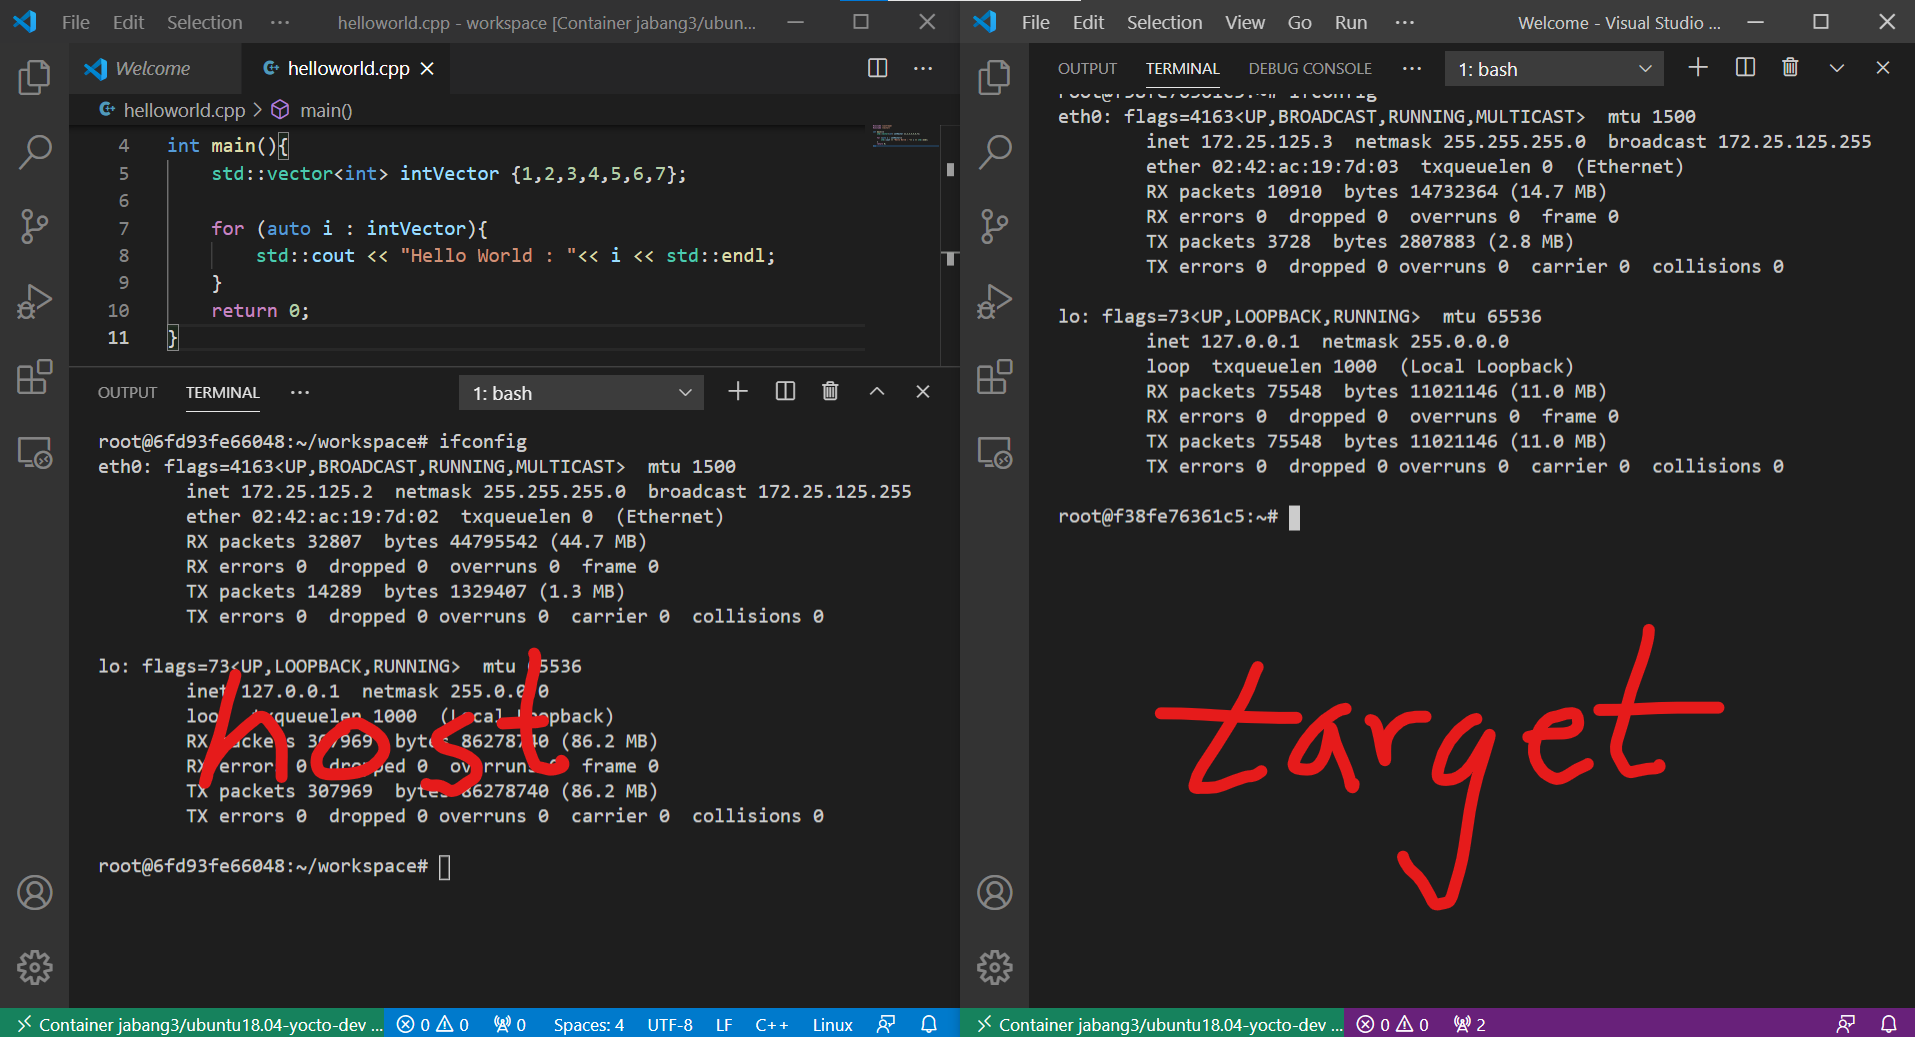
The diagram above shows a situation where two VS Code instances each have Docker containers running.
- Host IP: 172.25.125.2
- Target IP: 172.25.125.3
1. Printing Hello World
The test scenario we want to test is as follows:
- Compile Helloworld.cpp for the target on the host and send it to the target
- Not Stripped, with debug info, no optimization
- Connect GDBServer and GDB
- Real-time debugging of the application on the target from the host via network
The Helloworld.cpp test code is as follows:
#include <iostream>
#include <vector>

int main(){
    std::vector<int> intVector {1,2,3,4,5,6,7};

    for (auto i : intVector){
        std::cout << "Hello World : "<< i << std::endl;
    }
    return 0;
}
1. Compile Helloworld.cpp for the target on the host and send it to the target

2. Connect GDBServer and GDB
-
[TARGET] First, let’s start GDBServer on the target to put it in listening state

-
[HOST] Run GDB and connect to GDBServer over the network

-
[HOST, TARGET] Successfully connected screen

4. Real-time debugging of the application on the target from the host via network
-
[HOST] Set a breakpoint at the main function and check

-
[HOST] Execute
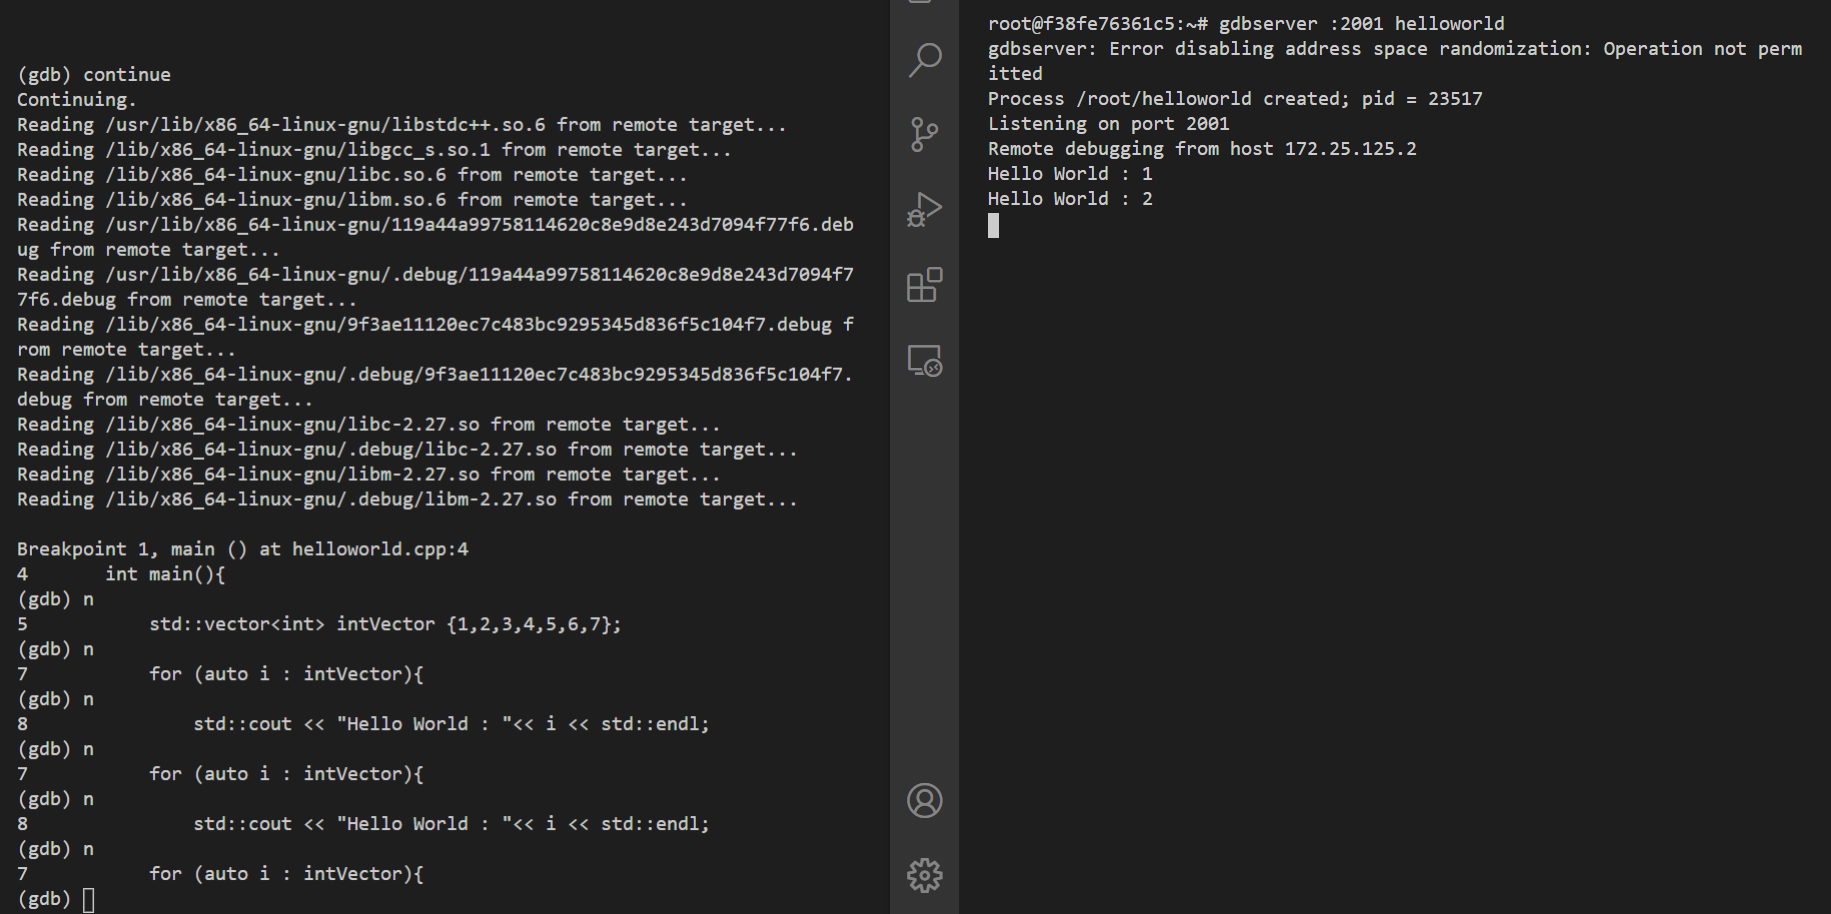
- The run command is not available in gdb connected remotely
- When you proceed line by line with ‘n’ from the HOST, you can see messages from std::cout appearing on stdout on the TARGET
2. Attaching to Running Applications
Besides starting an application from scratch using GDBServer, you can also attach to applications that are already running just-in-time.
I’ll explain using an example that runs in an infinite loop like the one below:
//running_app.cpp
#include <iostream>
#include <vector>
#include <thread>
#include <chrono>

int main(){
    using namespace std::chrono_literals;
    while (true){
        std::vector<int> intVector {1,2,3,4,5,6,7};
        for (auto i : intVector){
            std::cout << "Hello World : "<< i << std::endl;
            std::this_thread::sleep_for(1s);
        }
    }

    return 0;
}
The above example will repeatedly output “Hello World : 1 ~ 7” to stdout every second.
[TARGET] First, let’s move the built application above to the target and run it.
-
running_app is running with pid=25685 assigned.

[TARGET] Let’s attach gdbserver to running_app
-
When listening starts normally, you’ll see logs like below

[HOST] Connect to the TARGET with gdb as follows
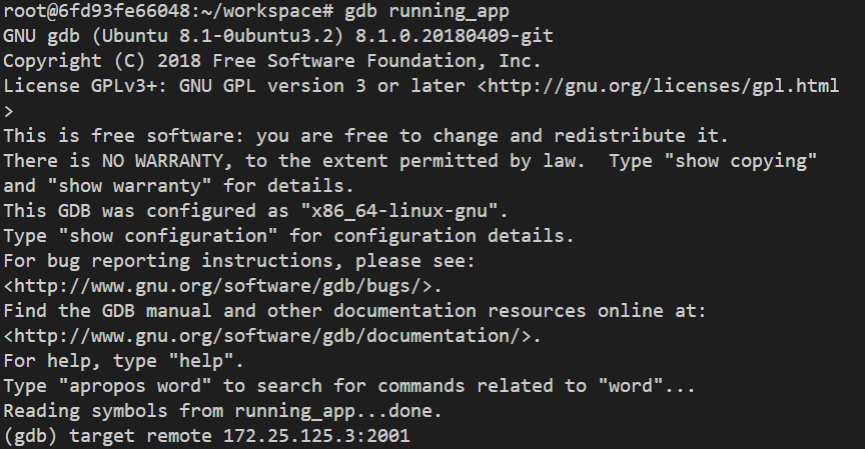
-
The TARGET’s operation pauses as soon as you connect

-
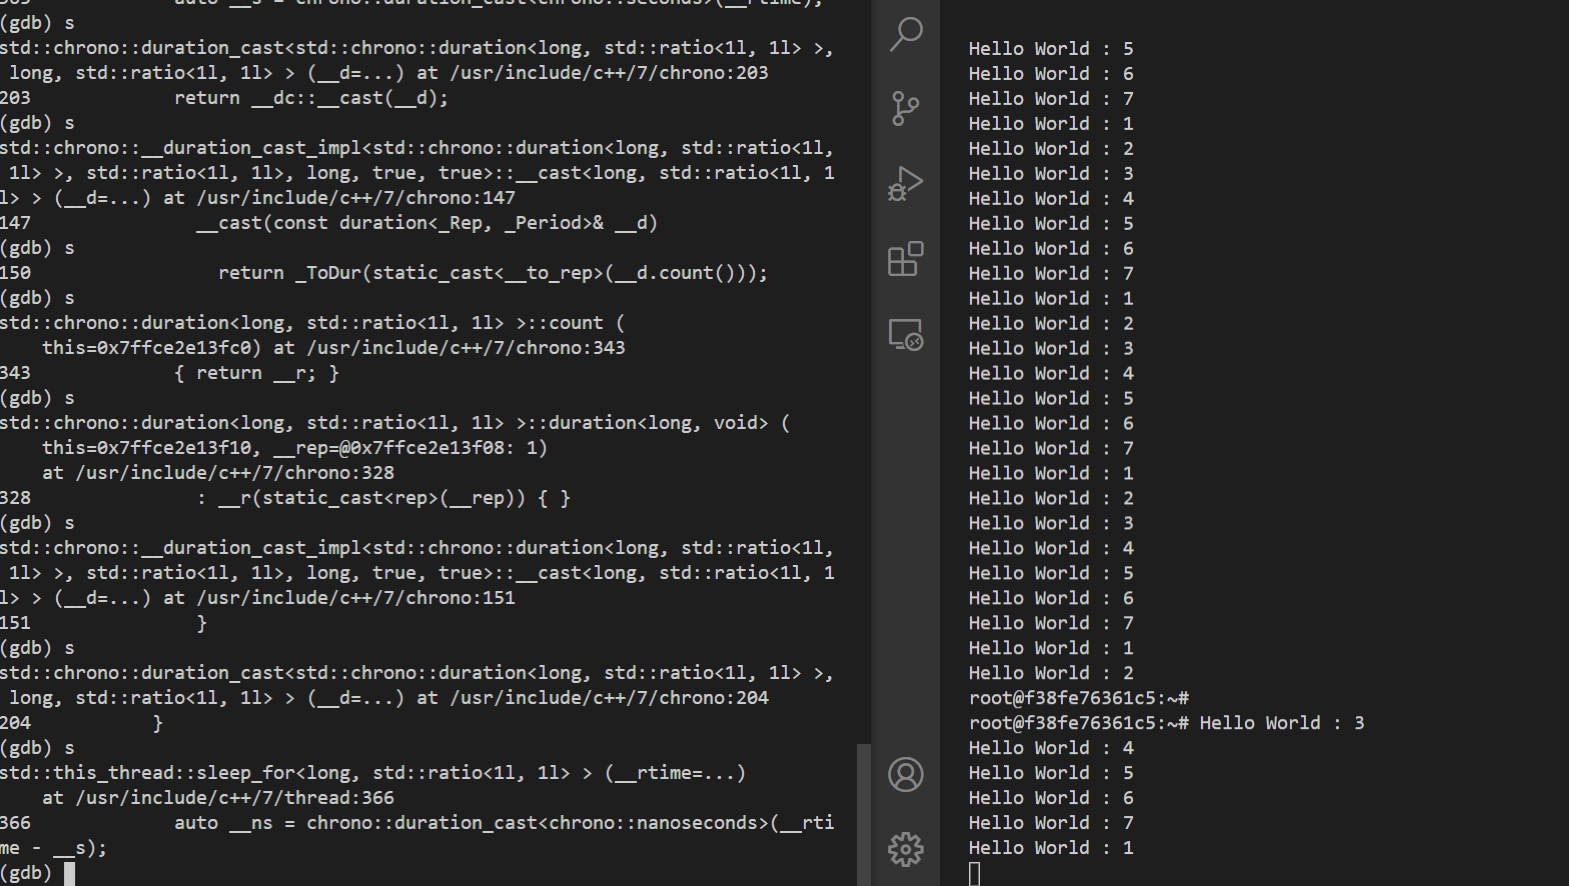
Looking at the logs, the connection point was when it was executing

std::this_thread::sleep_for(1s);- Symbol tracing is impossible because there’s no source code for the nanosleep.c side
[HOST] You can proceed with line-by-line debugging using n or s commands
-
n command (next)

-
s command (step into)
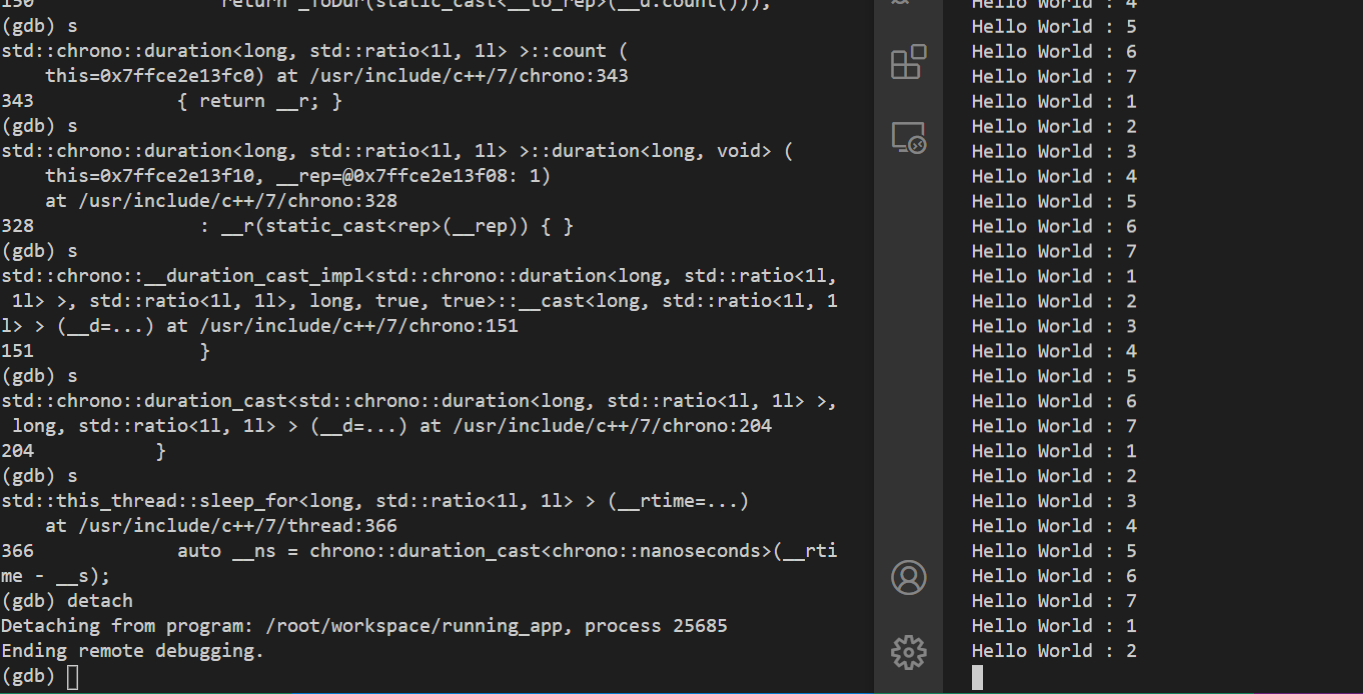
[HOST] You can make it resume normal operation through detach
-
It resumes normal operation from the last point where you were debugging