Remote Debugging with VS Code
Preface
This post is a continuation of the following post:
- Remote Debugging Using Gdbserver
- I’m also planning to write about VS Code’s Remote-Development feature (to be uploaded later)
We’ll continue using the environment that was set up in Remote Debugging Using Gdbserver.
0. Setting up Environment
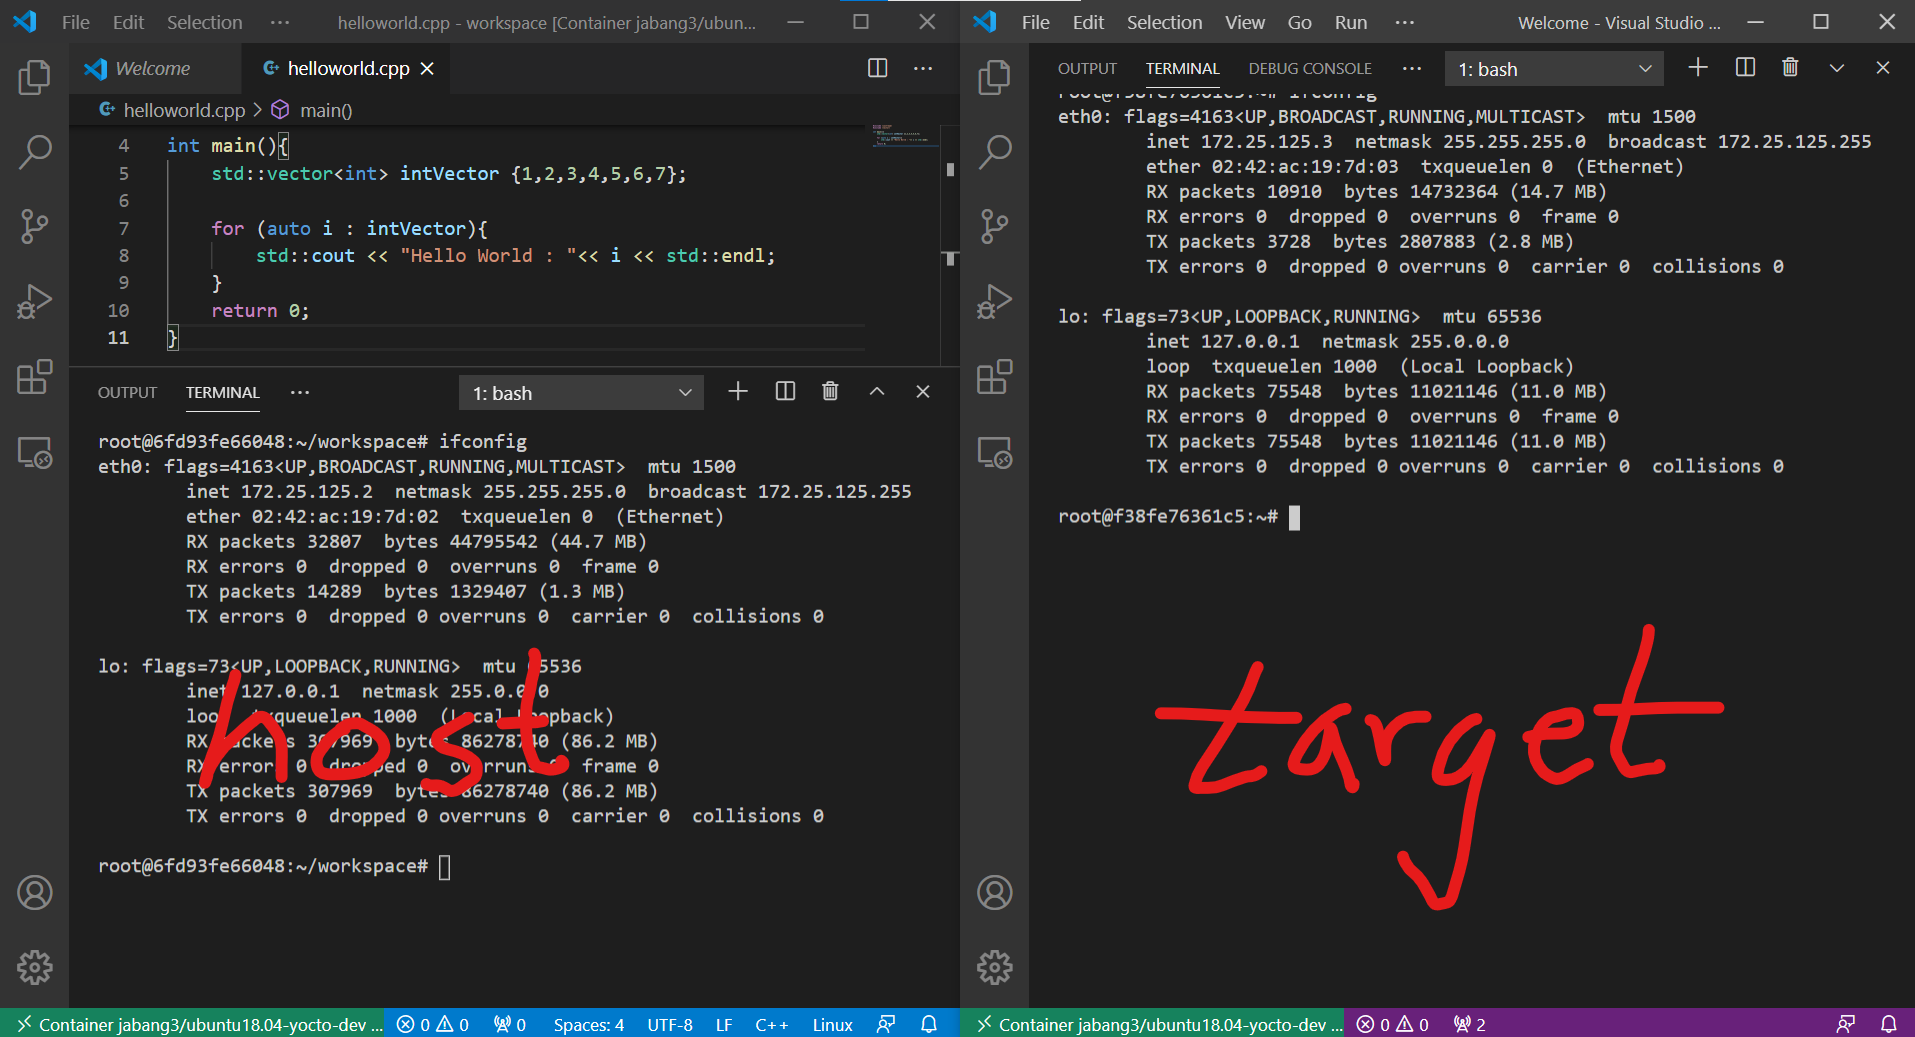
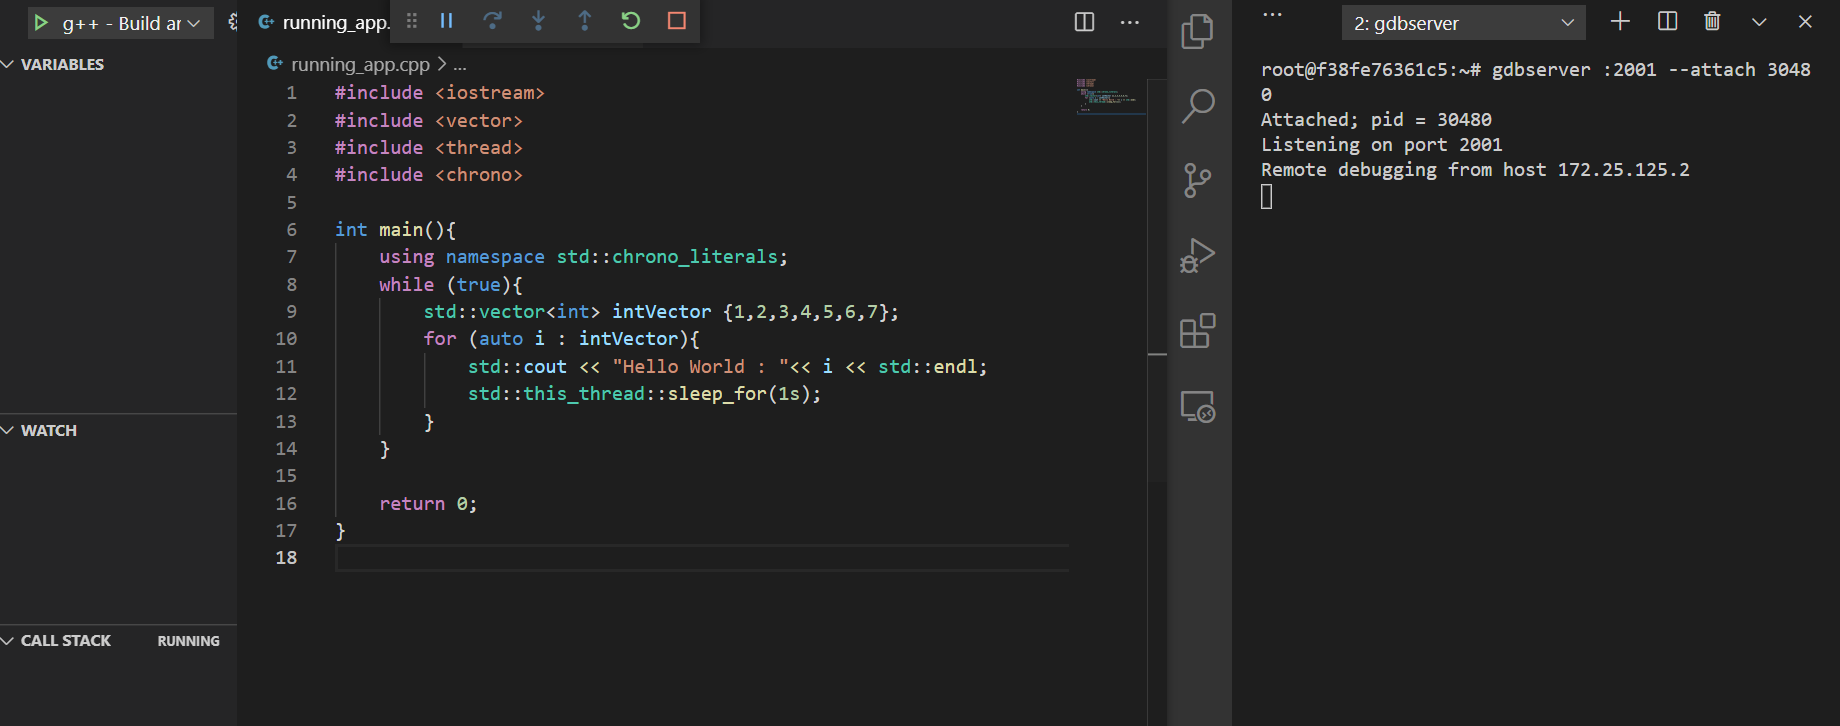
The image above shows two VS Code instances, each running Docker containers.
- Host IP: 172.25.125.2
- Target IP: 172.25.125.3
VS Code comes with a built-in Run Extension by default.
This Run feature uses a specific configuration file called launch.json to support various languages, compilers, and debuggers for execution.
1. Configuring launch.json
Press F1 to open the Command Palette and search for launch.json to execute it.
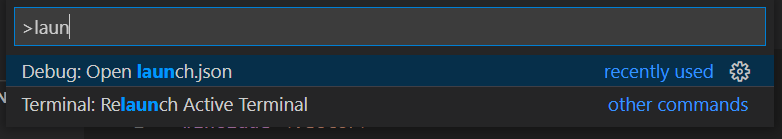
The launch.json file is created inside workspace/.vscode.
2. Debugging Running Application
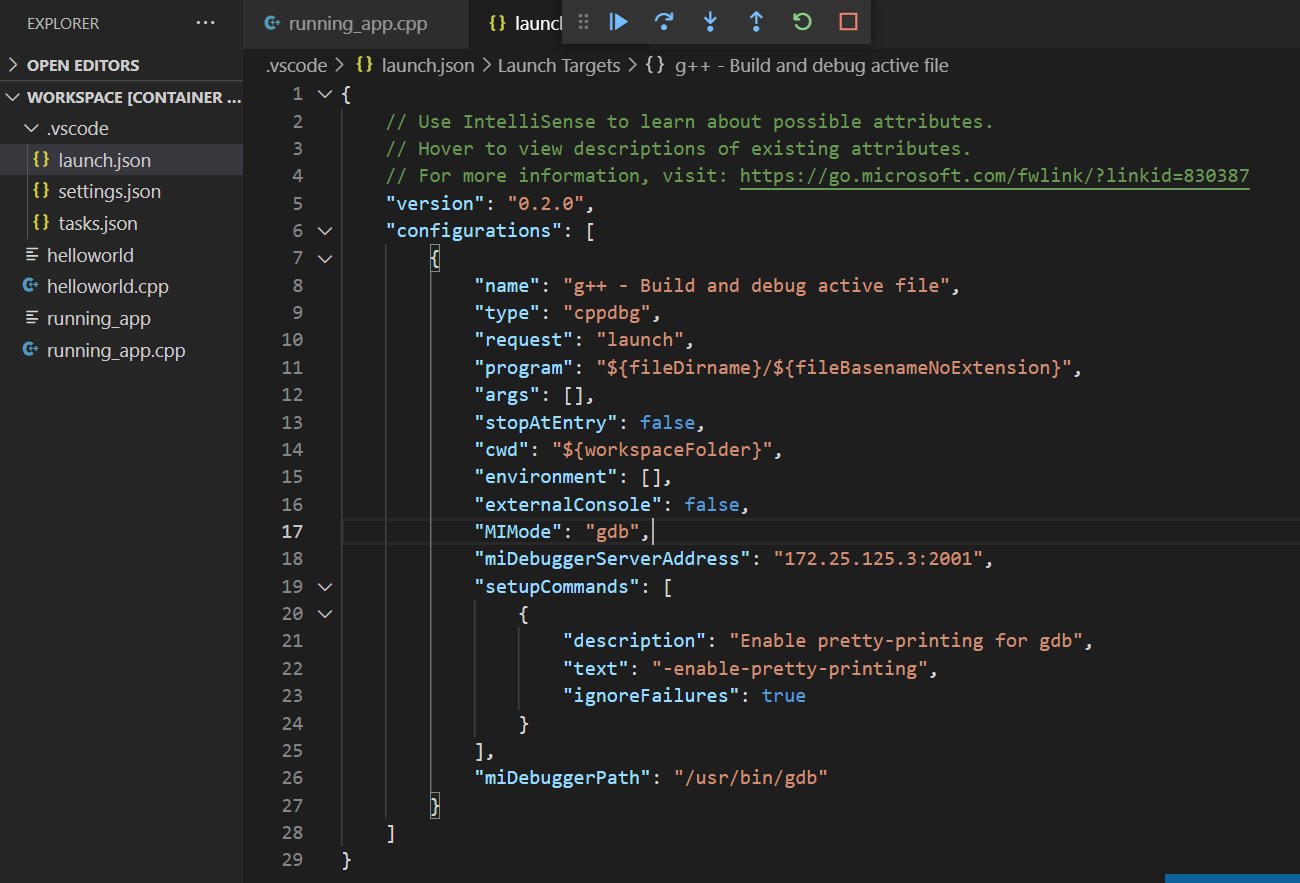
By modifying and adding a few things to launch.json, you can easily debug applications running on the TARGET.
- Remove prelaunchTask
- We assume the ELF has already been built on the HOST and transferred to the TARGET
- Add miDebuggerServerAddress → Enter the IP address and port of the TARGET’s gdbserver
- ex) “miDebuggerServerAddress”: “172.25.125.3:2001”
Now navigate to the source code and click on the Run Extension in the left bar.
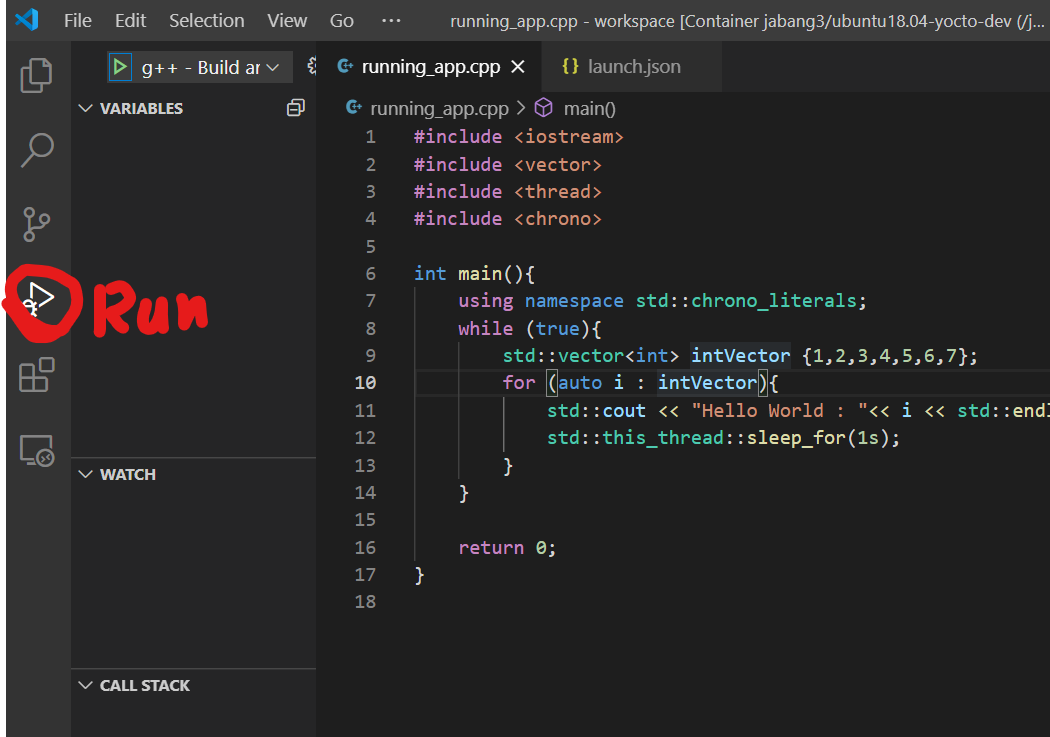
Click the play button in the top left to establish a debugging session.
-
The GDB Server must be in listening state
-
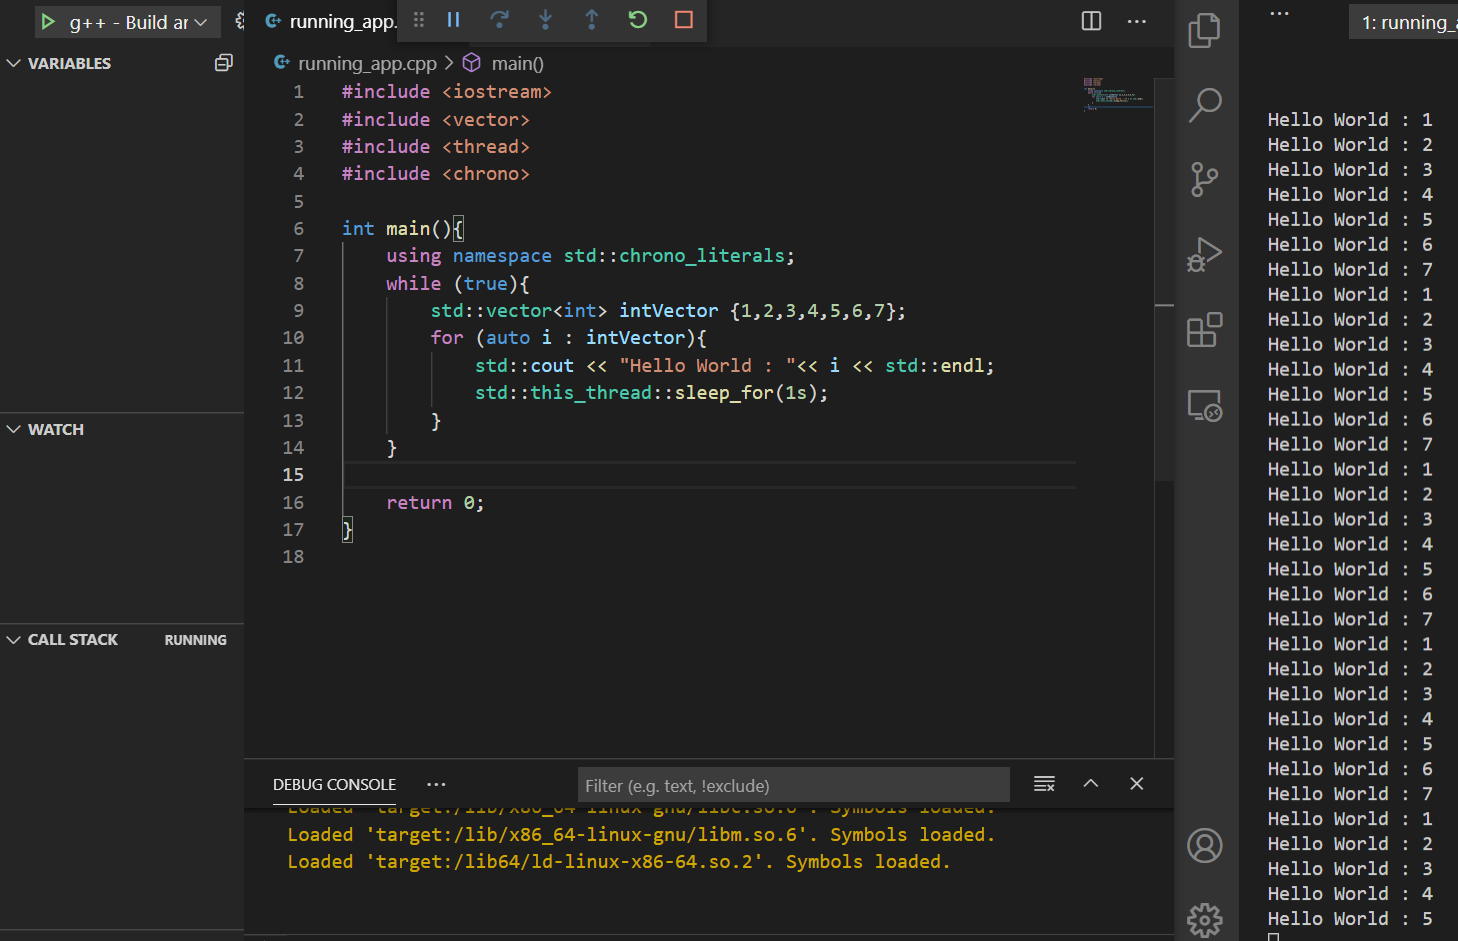
The session is connected, but if you don’t set a breakpoint, the TARGET application will continue running
-
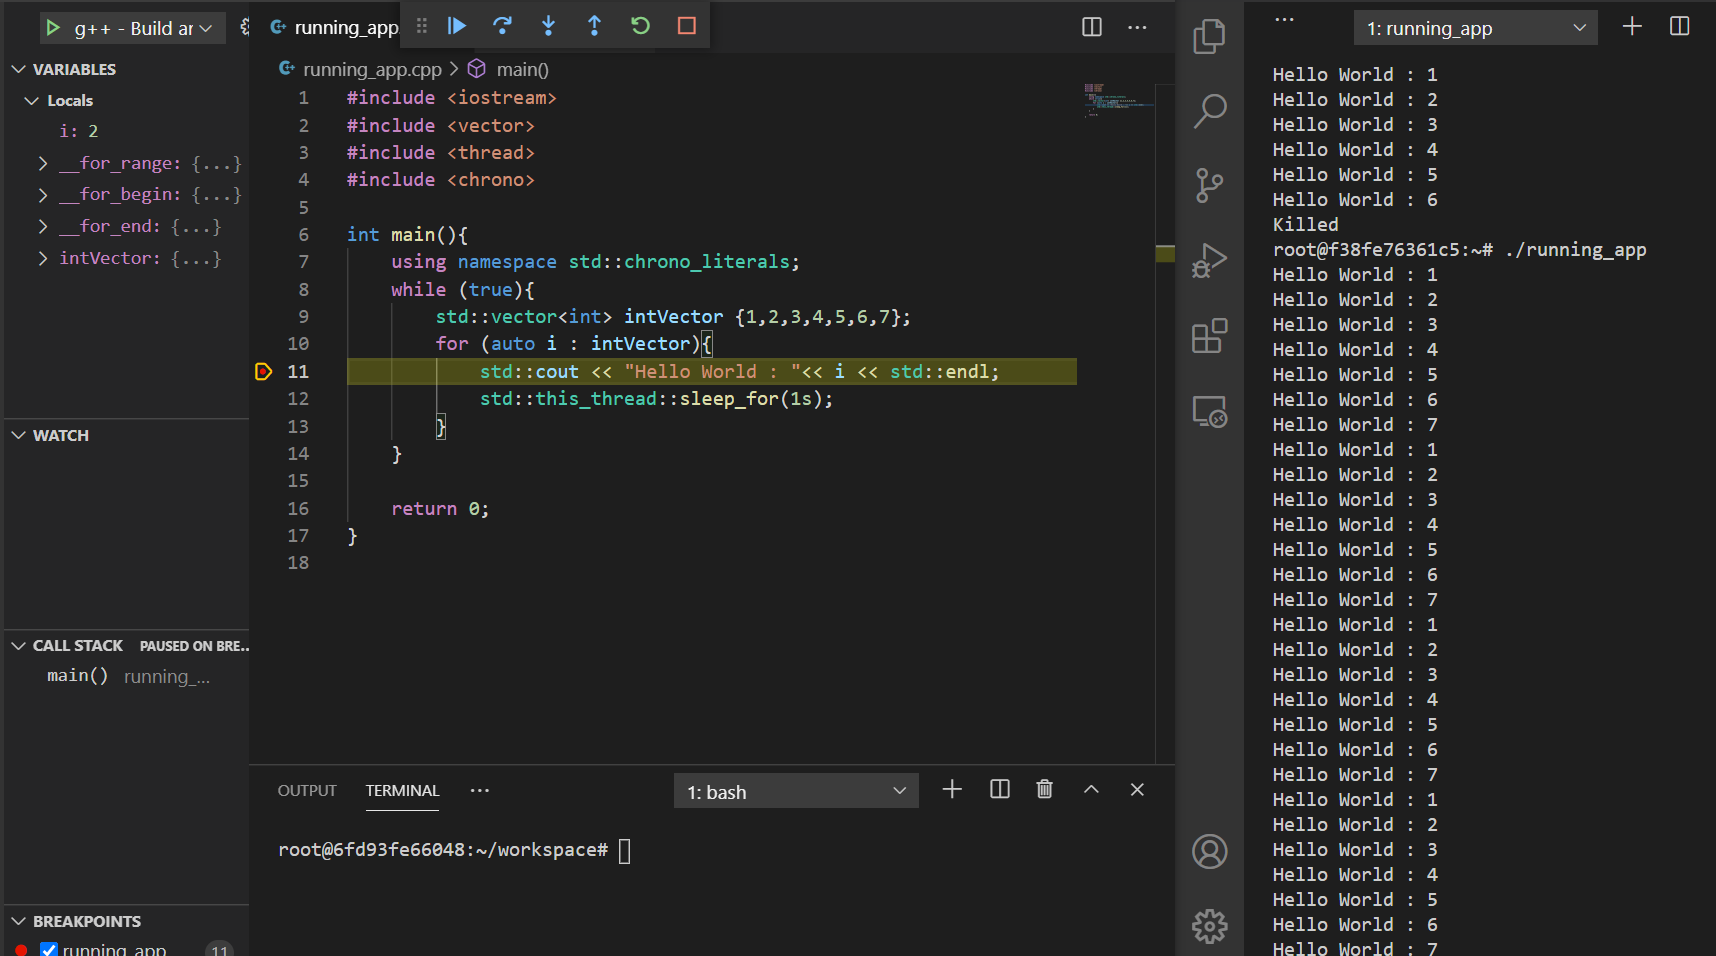
Toggle breakpoints by clicking to the left of the line number or using the F9 key
-
Once you set a breakpoint, the TARGET execution will immediately pause, and you can trace variables and the call stack at that line
-