04.Remote Debugging Using VSCode
Preface
본 포스팅은 아래 포스팅의 연장선이다.
- 03.RemoteDebuggingUsingGdbserver
- VS Code의 Remote-Development 기능에 대한 포스팅도 설명예정 (추후 업로드)
03.RemoteDebuggingUsingGdbserver 에서 Setup한 환경을 그대로 이어간다.
0. Setting up Environment
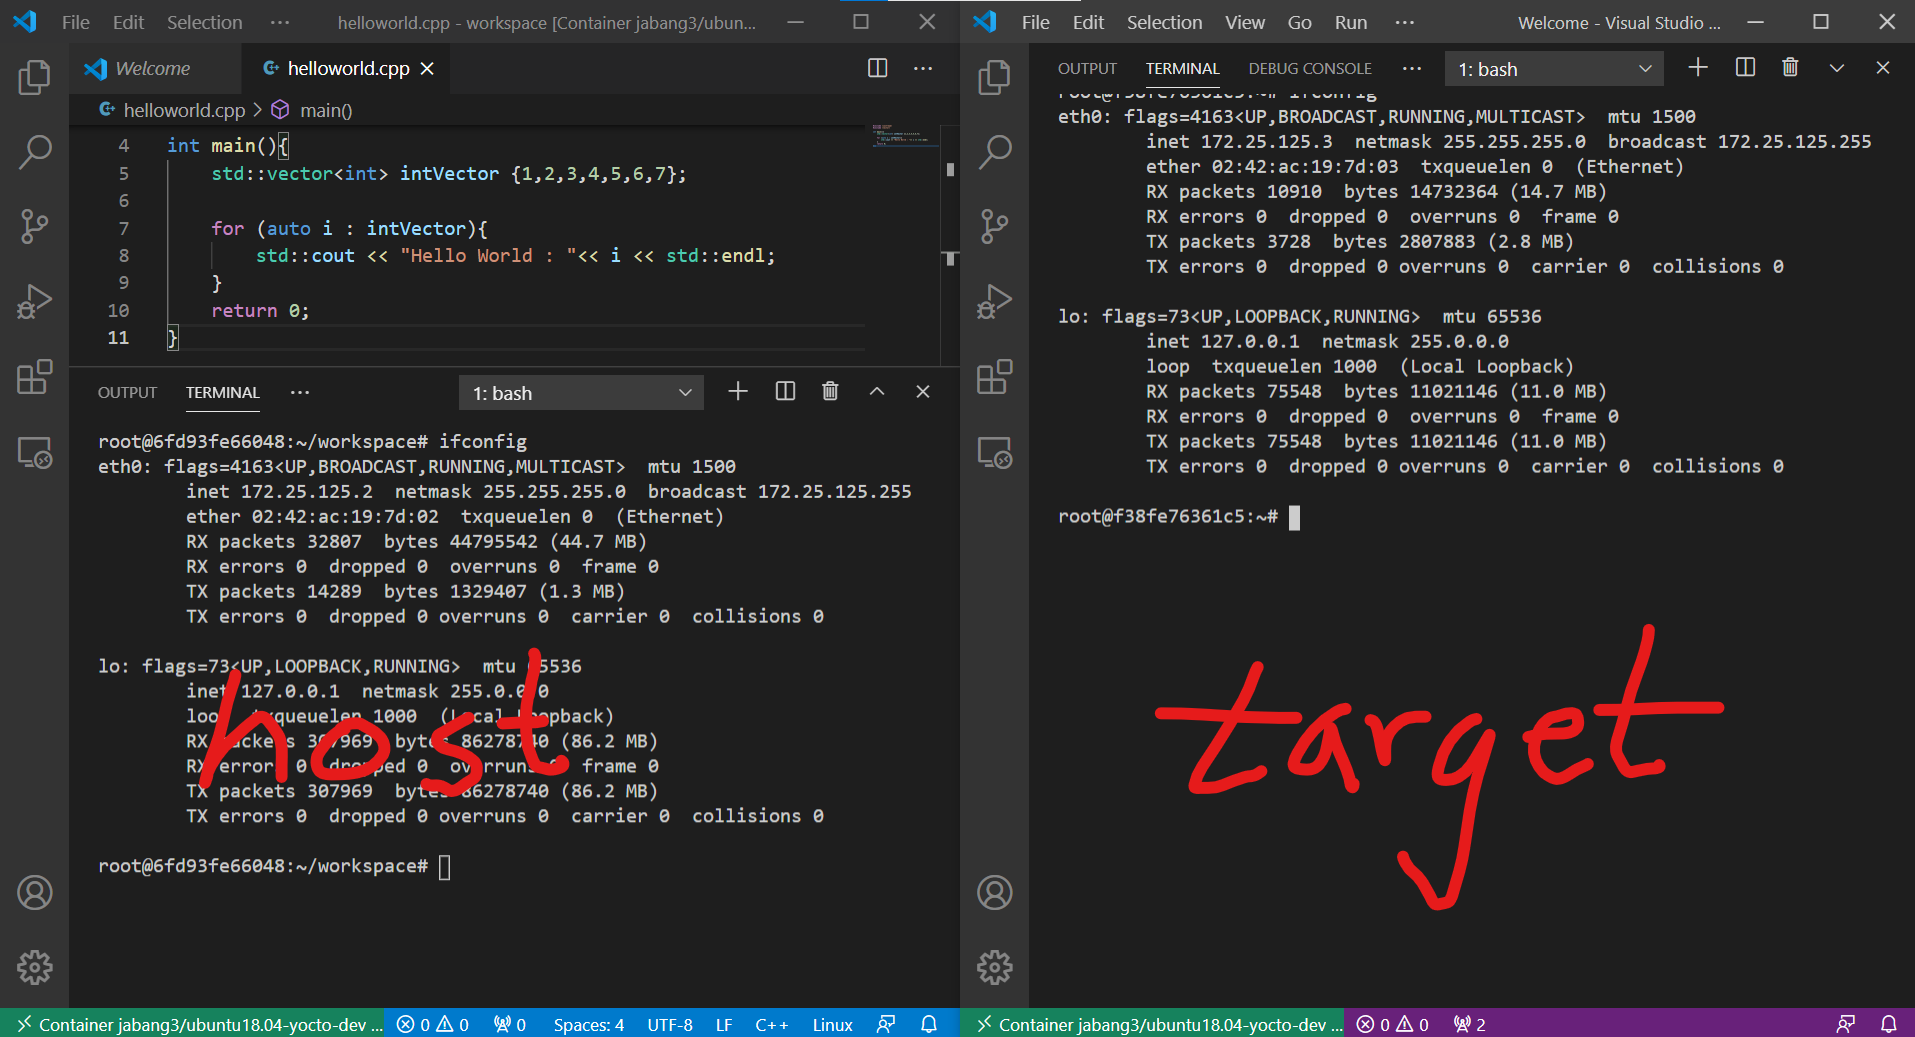 위 그림은 두개의 VS Code에서 각각 Docker Container를 띄운 상황이다.
- Host IP : 172.25.125.2
- Target IP : 172.25.125.3
VSCode에는 Run Extension을 기본으로 제공한다.
이 Run은 다양한 언어 및 Compiler, Debugger를 지원하기 위해서 launch.json이라는 특정 설정파일로 부터 실행(Run)을 한다.
1. Configuring launch.json
F1 Key 를 눌러 Command Pallate를 열고 launch.json을 검색하여 실행하자.
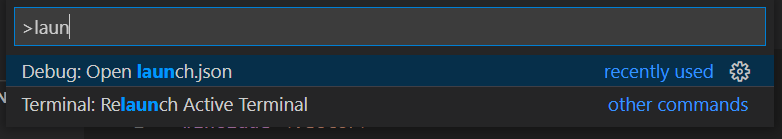
launch.json은 workspace/.vscode 안에 생성이된다.
2. Debbuing Running Application
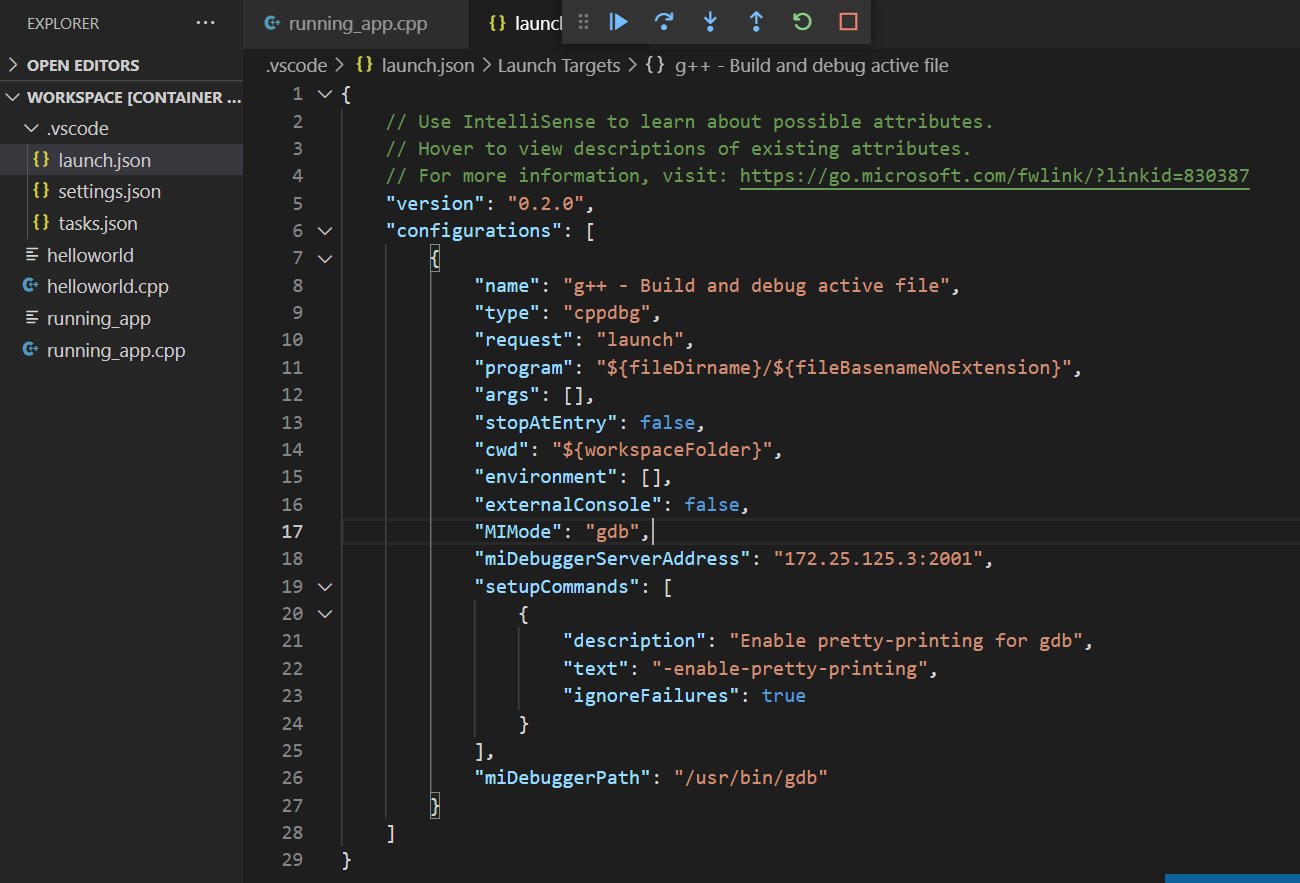
launch.json에서 몇가지를 수정 및 추가하면 쉽게 TARGET에서 동작중인 Application을 Debugging할 수 있다
- prelaunchTask 삭제
- 이미 HOST에서 빌드 후 TARGET에 elf를 전송했다고 가정
- miDebuggerServerAddress 추가 → TARGET의 gdbserver의 Ip와 port를 입력
- ex) “miDebuggerServerAddress”: “172.25.125.3:2001”
그리고 Source 로 이동하여 좌측 Bar에서 Run Exetension을 클릭하자
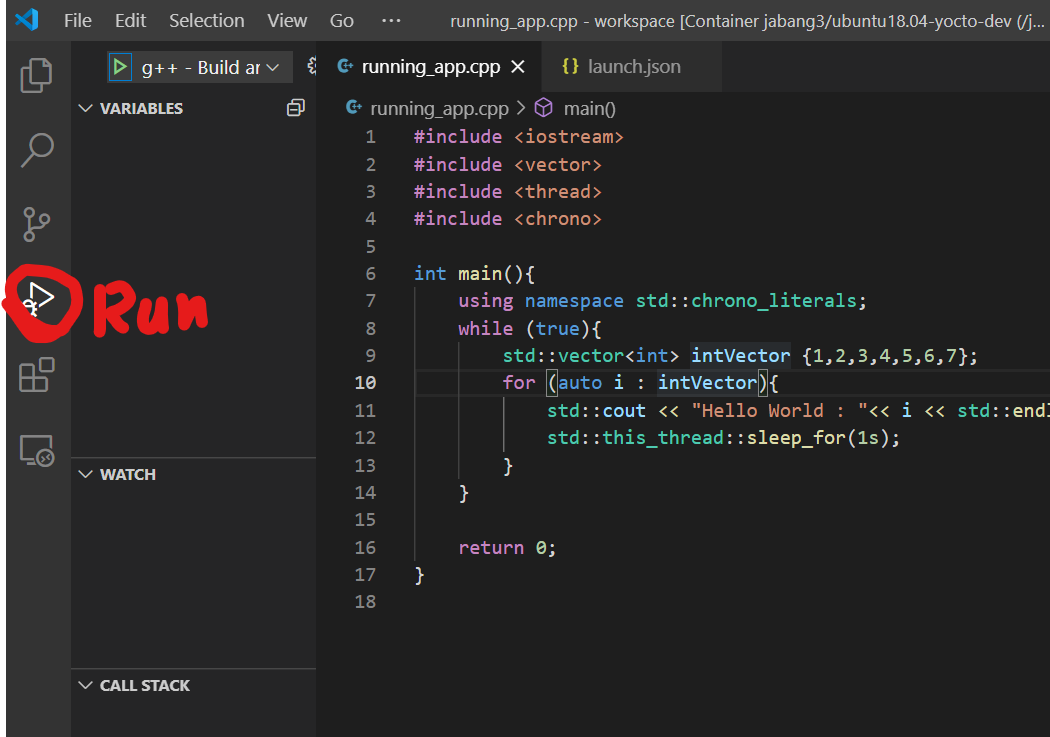
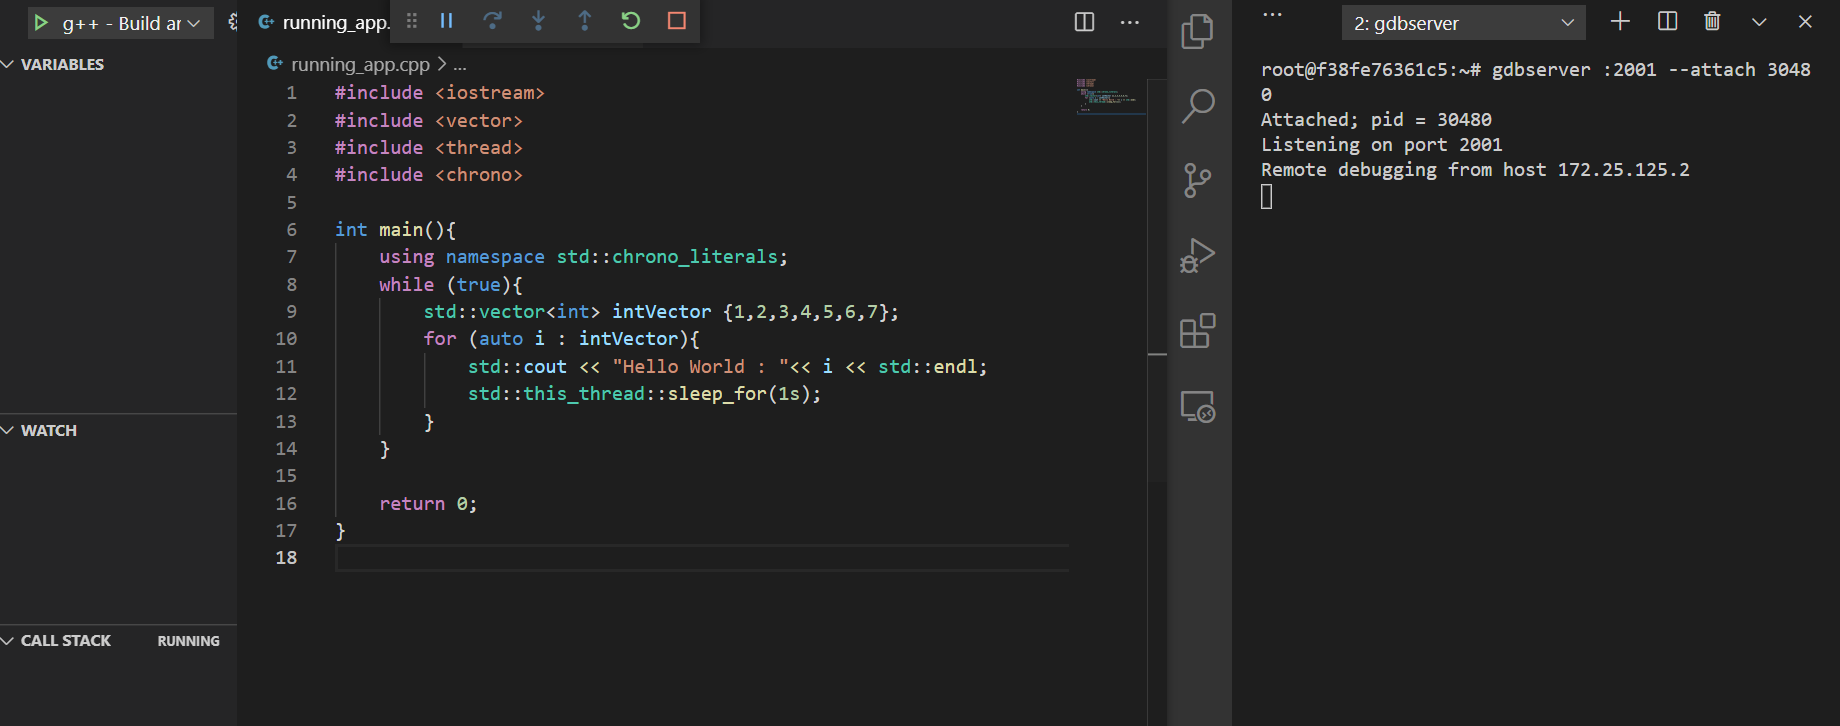
좌측 상단의 재생버튼을 클릭하면 Debugging Session이 연결된다.
-
GDBServer는 Listening 상태여야 한다
-
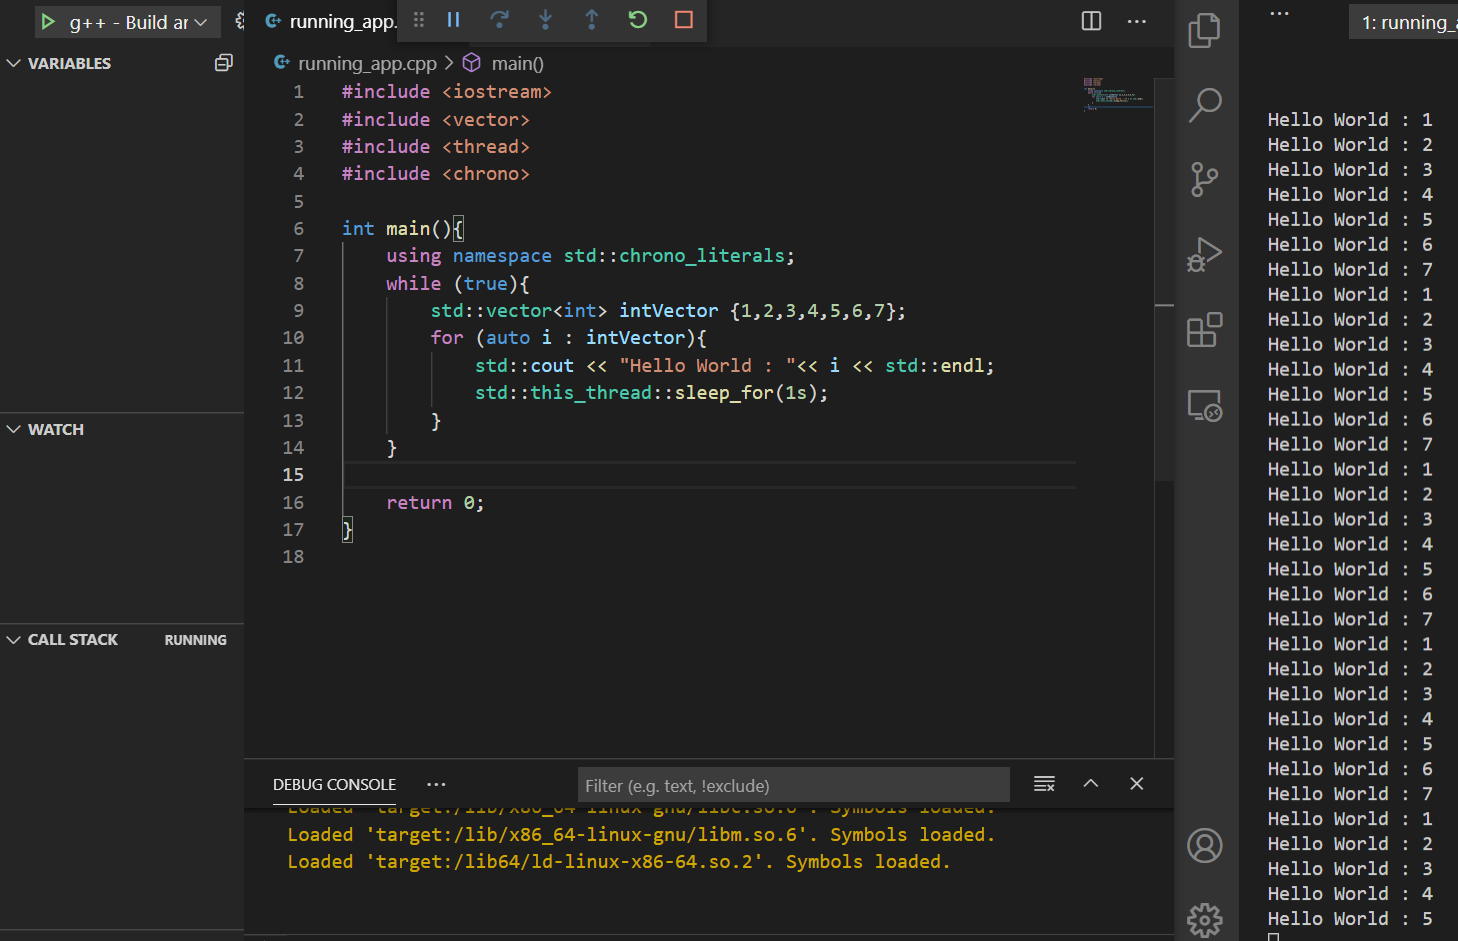
세션은 연결되었지만 breaking point를 설정하지 않으면 TARGET의 Application은 계속해서 실행상태를 유지한다
-
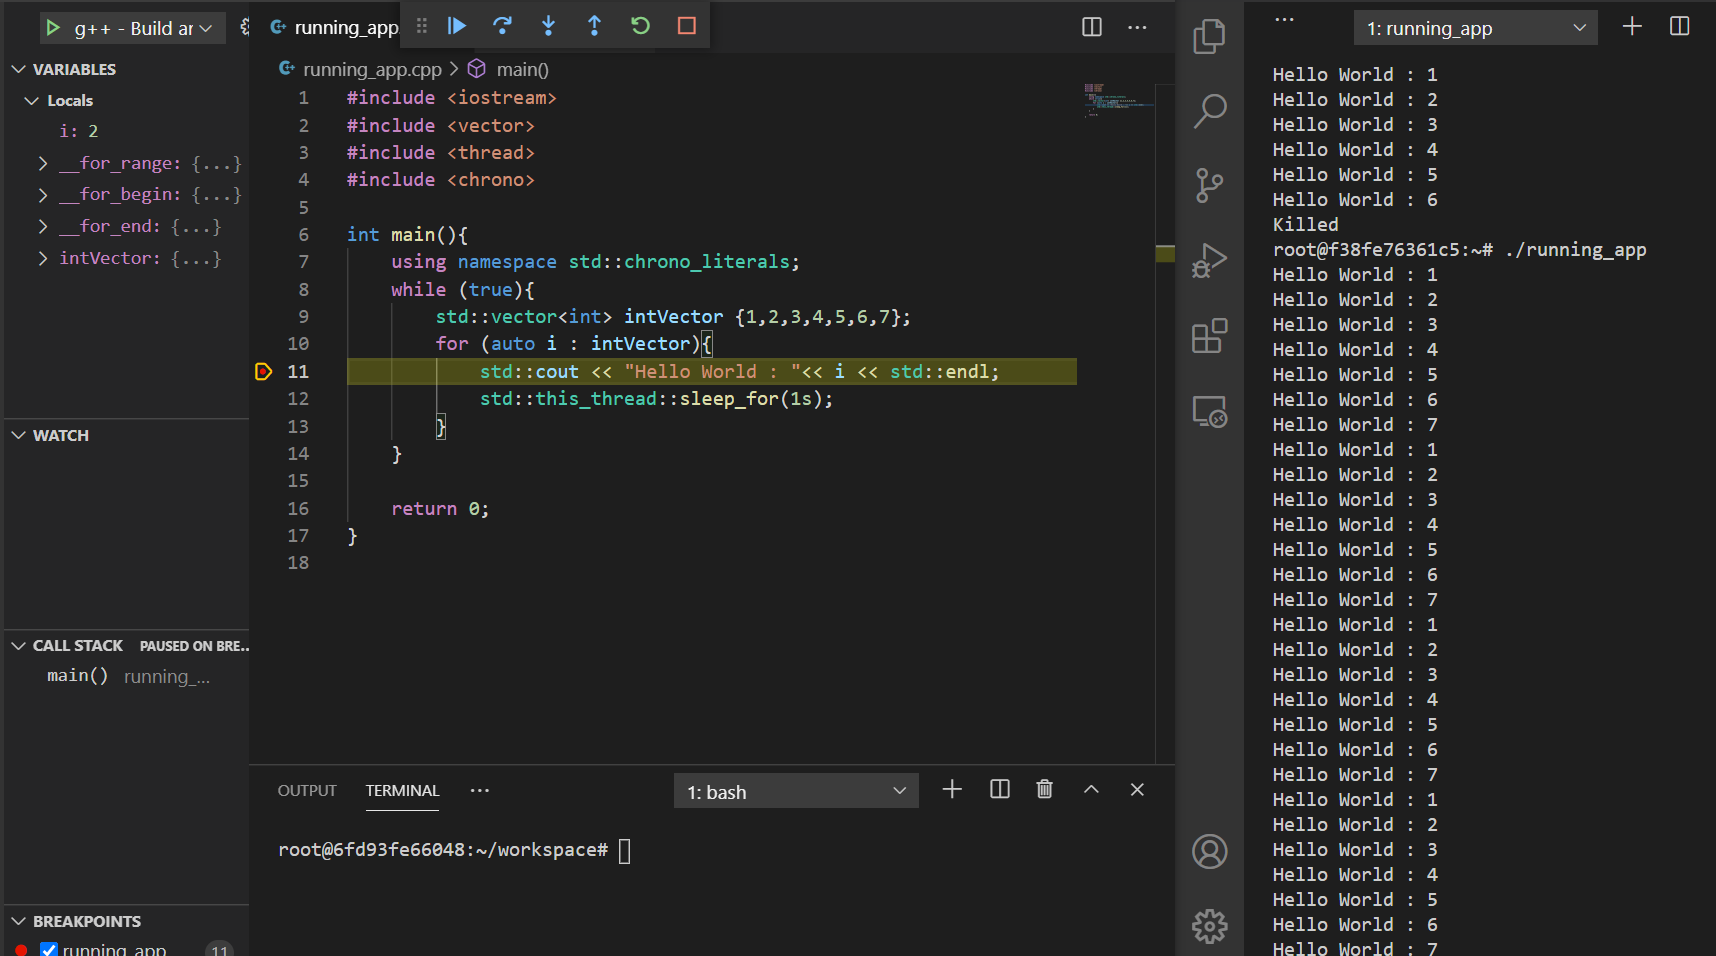
Toggle breaking point 는 라인넘버 왼쪽을 마우스 클릭하거나 F9 Key를 이용하여 설정한다
-
Breaking Point를 설정하면 바로 TARGET의 동작이 멈추고 해당 라인에서 Variable 과 Call Stack이 추적가능해진다
-