Preface
본 포스팅은 아래 포스팅의 연장선이다.
- 03.RemoteDebuggingUsingGdbserver
- VS Code의 Remote-Development 기능에 대한 포스팅도 설명예정 (추후 업로드)
03.RemoteDebuggingUsingGdbserver 에서 Setup한 환경을 그대로 이어간다.
0. Setting up Environment
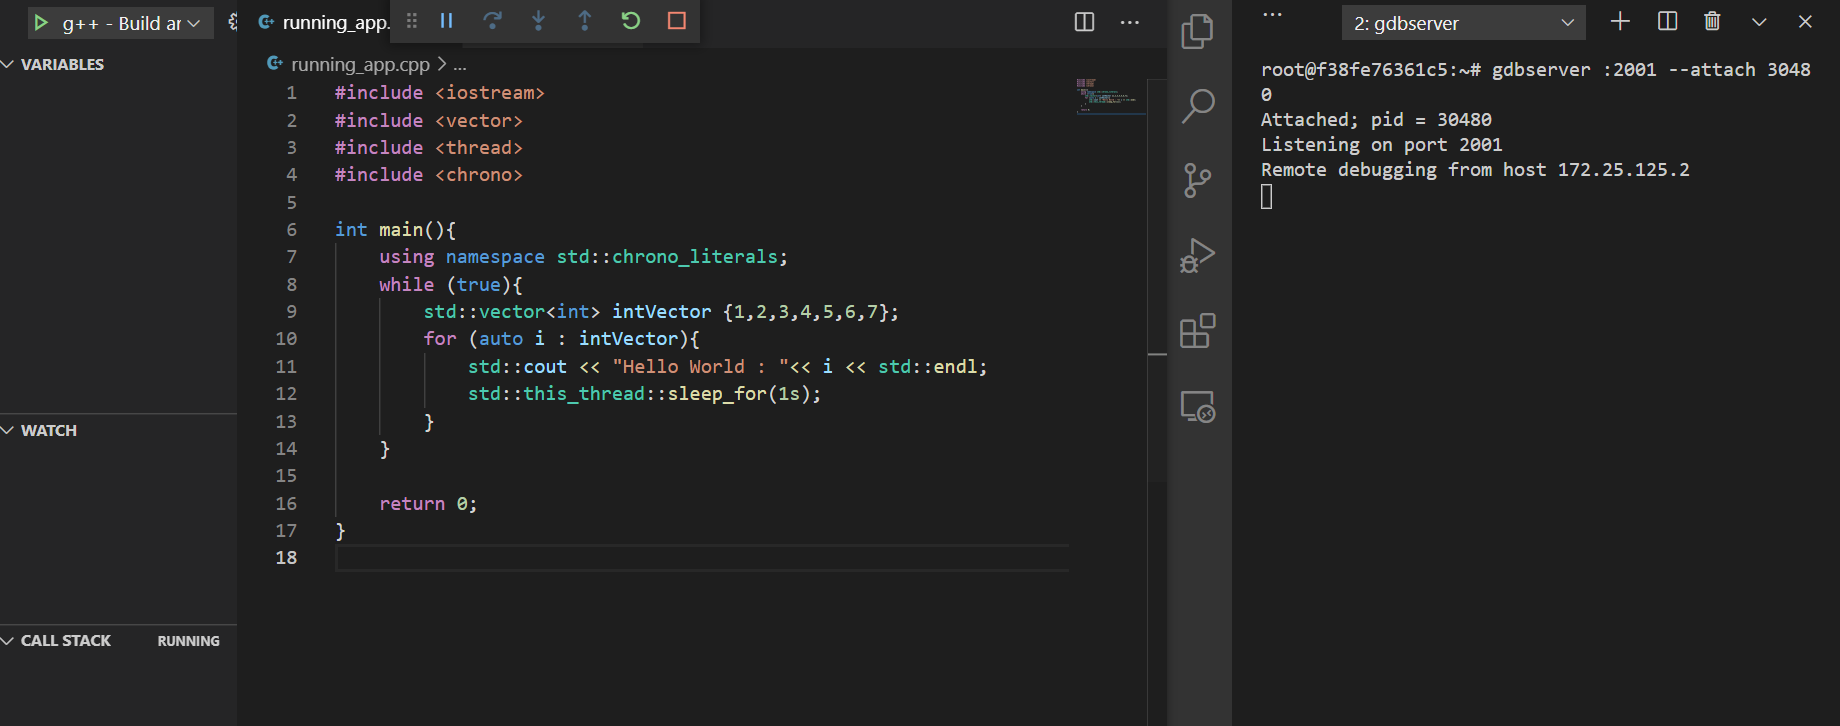
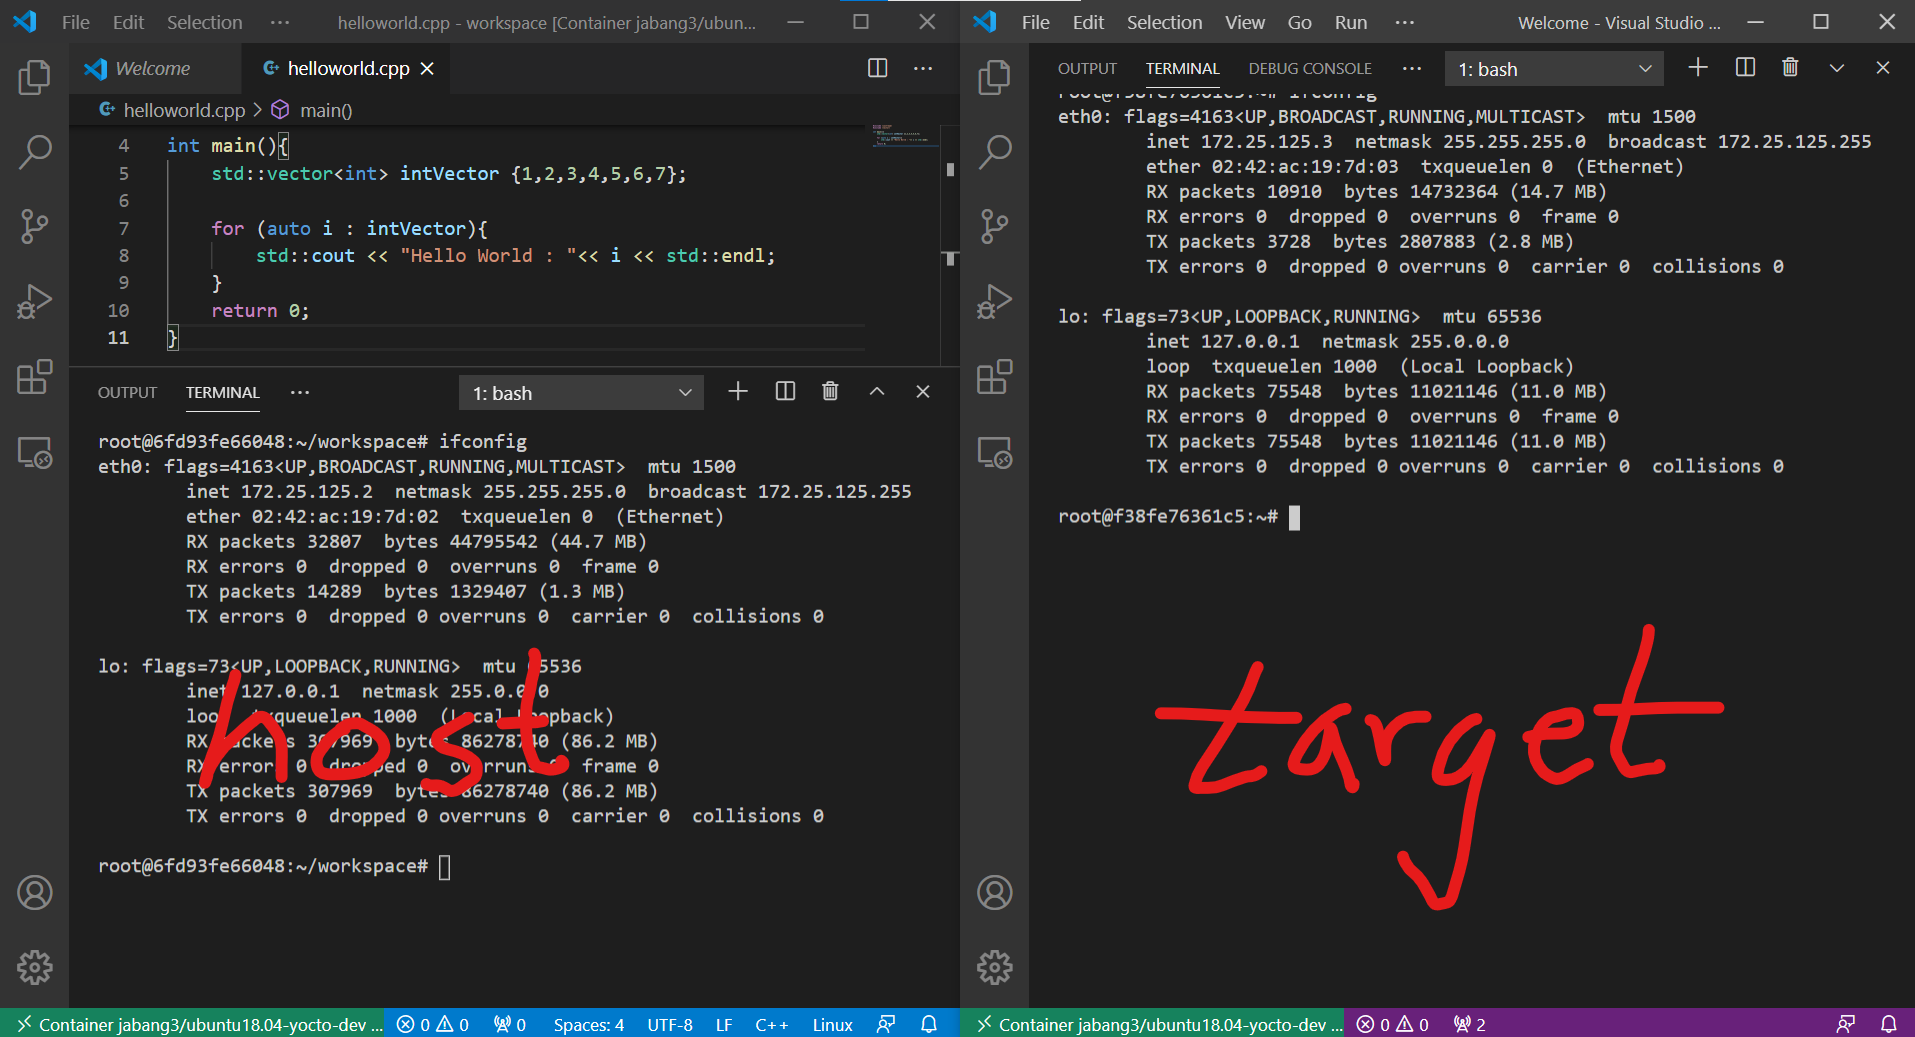 위 그림은 두개의 VS Code에서 각각 Docker Container를 띄운 상황이다.
- Host IP : 172.25.125.2
- Target IP : 172.25.125.3
VSCode에는 Run Extension을 기본으로 제공한다.
이 Run은 다양한 언어 및 Compiler, Debugger를 지원하기 위해서 launch.json이라는 특정 설정파일로 부터 실행(Run)을 한다.
1. Configuring launch.json
F1 Key 를 눌러 Command Pallate를 열고 launch.json을 검색하여 실행하자.
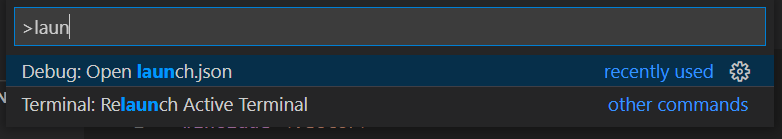
launch.json은 workspace/.vscode 안에 생성이된다.
2. Debbuing Running Application
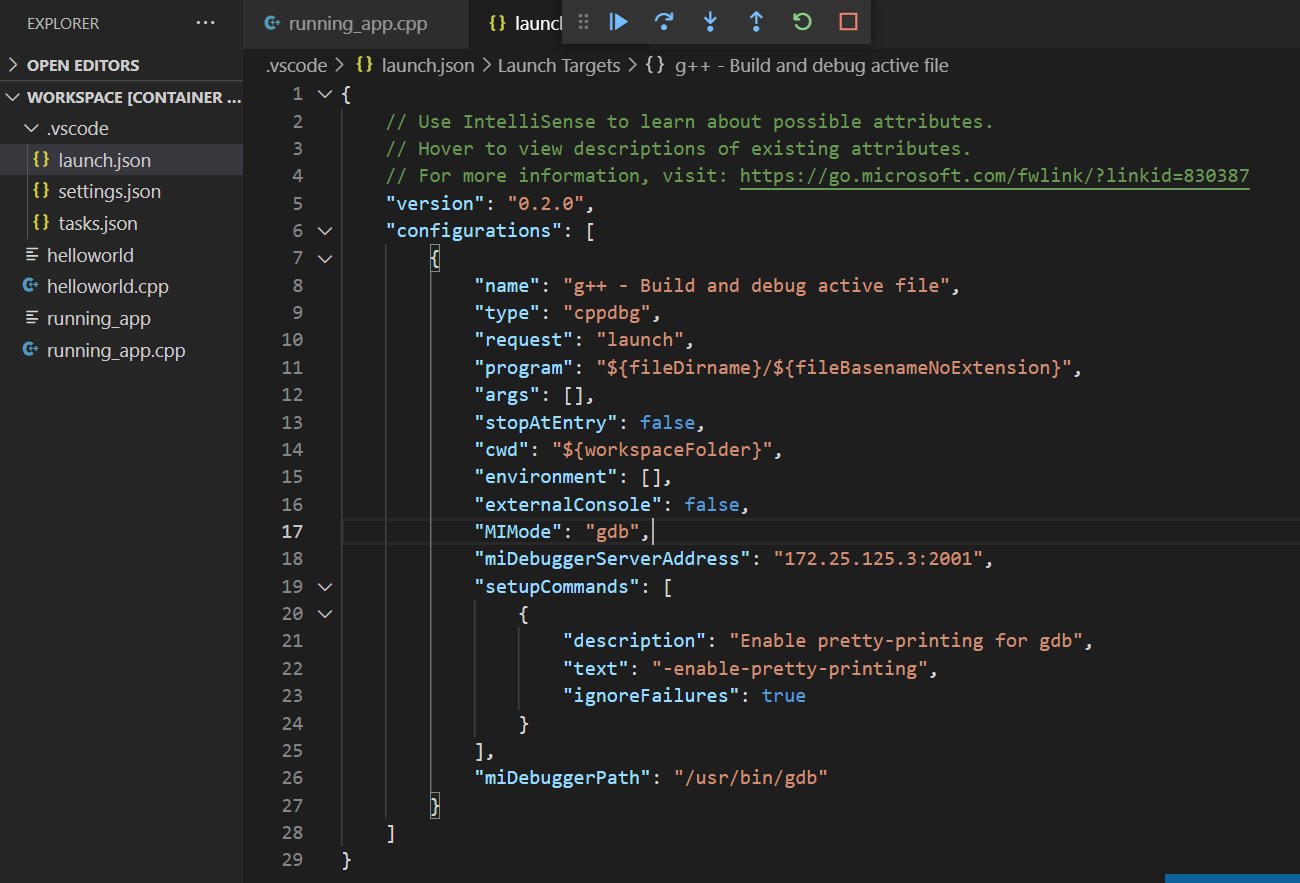
launch.json에서 몇가지를 수정 및 추가하면 쉽게 TARGET에서 동작중인 Application을 Debugging할 수 있다
- prelaunchTask 삭제
- 이미 HOST에서 빌드 후 TARGET에 elf를 전송했다고 가정
- miDebuggerServerAddress 추가 → TARGET의 gdbserver의 Ip와 port를 입력
- ex) “miDebuggerServerAddress”: “172.25.125.3:2001”
그리고 Source 로 이동하여 좌측 Bar에서 Run Exetension을 클릭하자
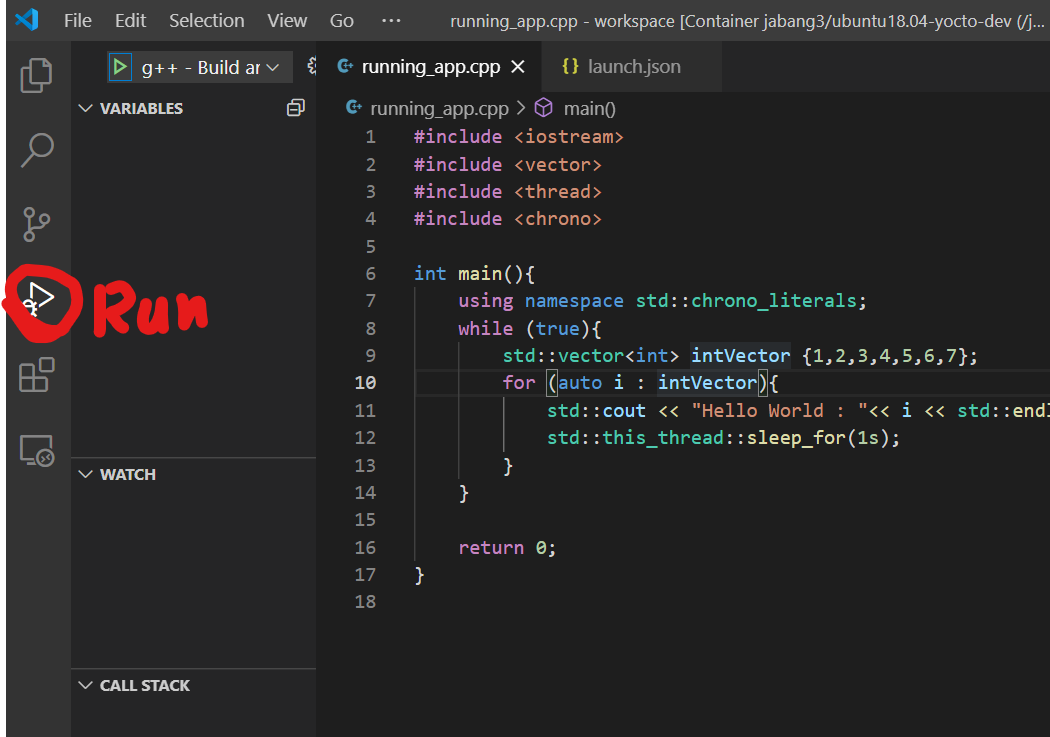
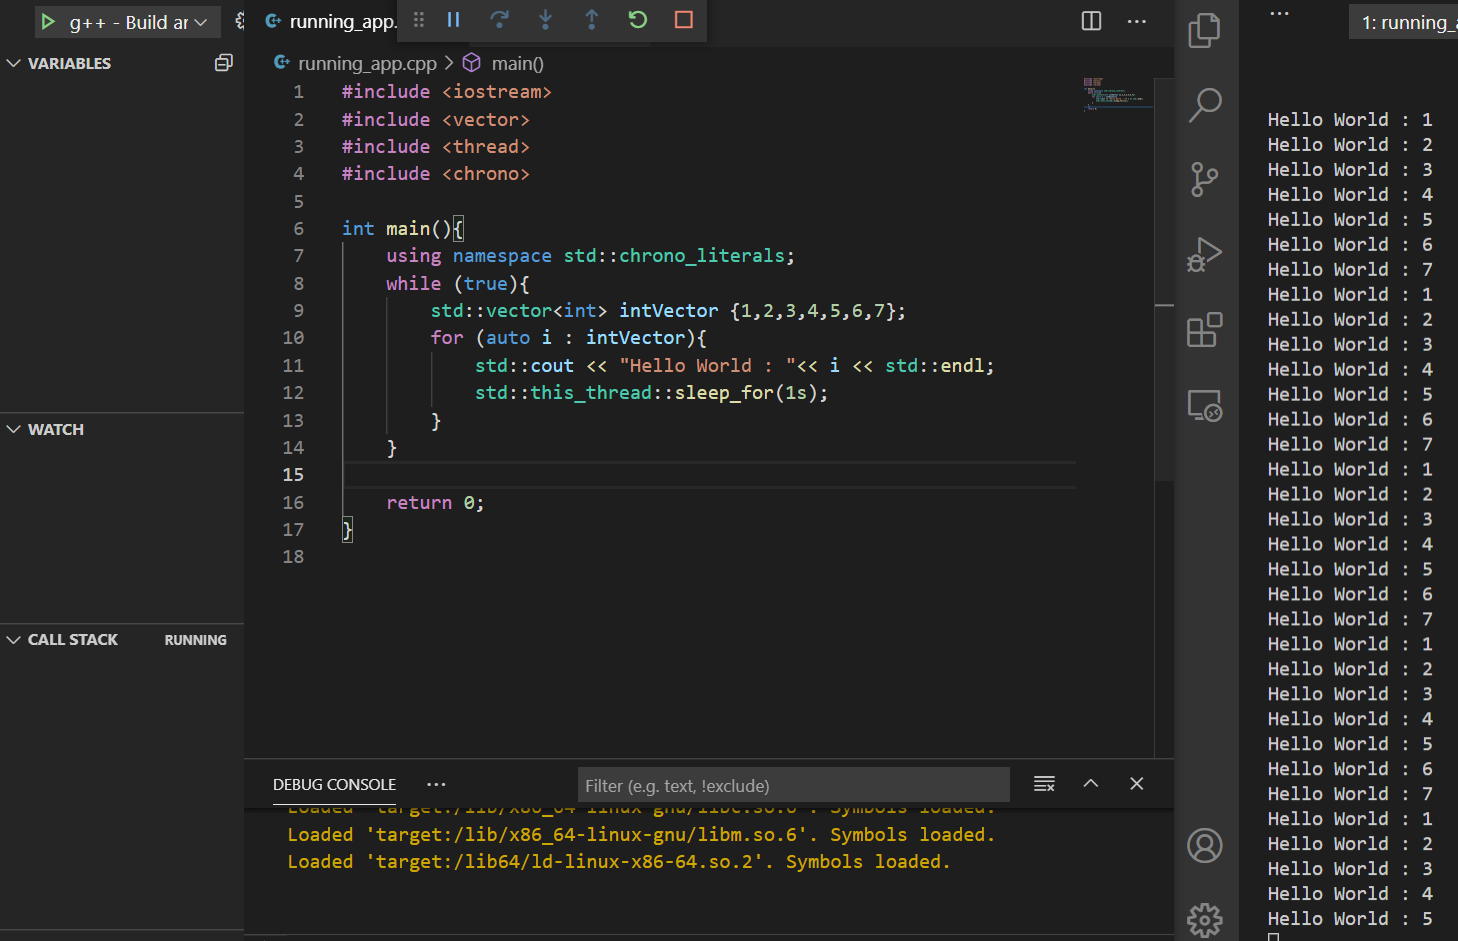
좌측 상단의 재생버튼을 클릭하면 Debugging Session이 연결된다.
GDBServer는 Listening 상태여야 한다

세션은 연결되었지만 breaking point를 설정하지 않으면 TARGET의 Application은 계속해서 실행상태를 유지한다
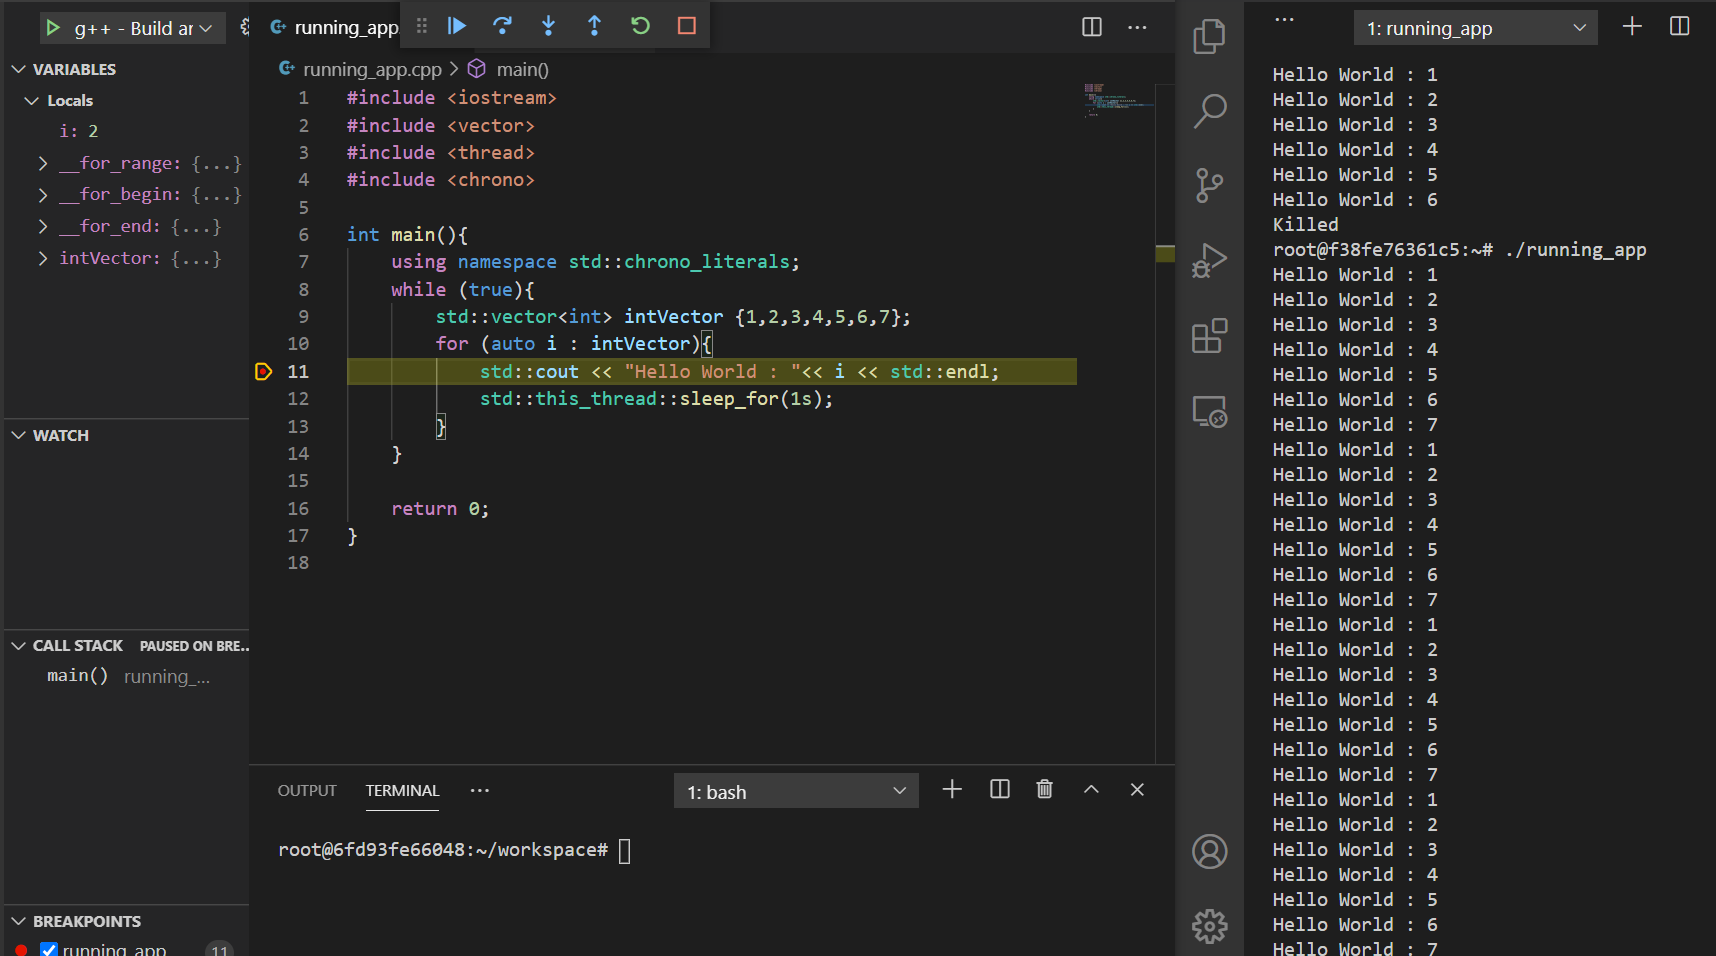
Toggle breaking point 는 라인넘버 왼쪽을 마우스 클릭하거나 F9 Key를 이용하여 설정한다
Breaking Point를 설정하면 바로 TARGET의 동작이 멈추고 해당 라인에서 Variable 과 Call Stack이 추적가능해진다